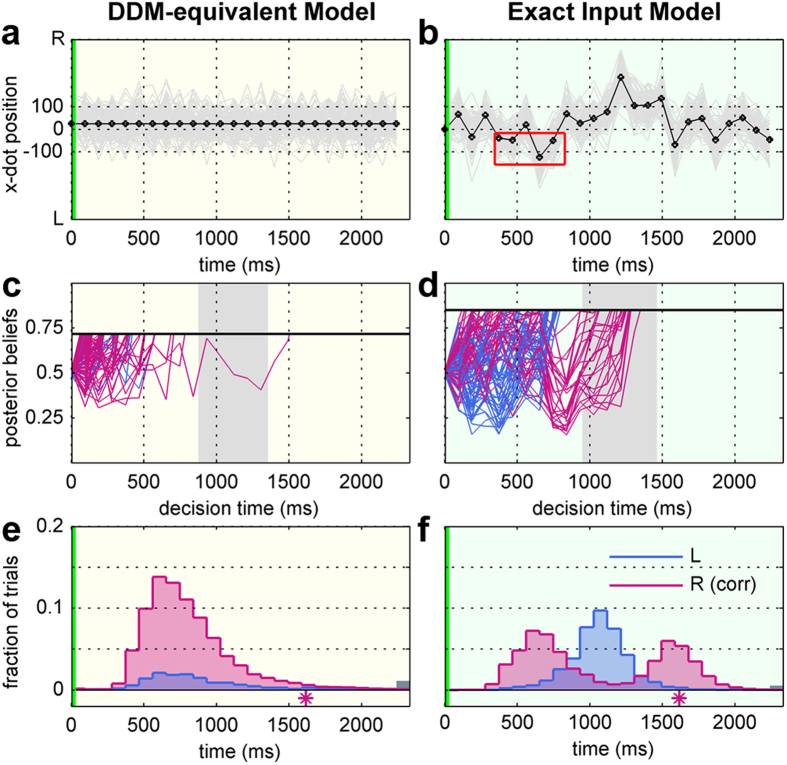
Figure 2. Single trial evidence accumulation and predicted RT distribution for DDM-equivalent model and exact input model (ExaM) from the second hardest difficulty level (D2) from participant 20.
(a) The input to the DDM-equivalent model: the mean of the correct target (black line indicating right target in this trial) with Gaussian noise (grey lines). (b) The input to the ExaM: exact dot position added with Gaussian noise. Red box indicates dots leading to an early left decision. (c) Posterior beliefs as in accumulated evidence, using the parameter estimates for participant 20, D2 under the DDM-equivalent model over 100 iterations. The model mostly predicts “right” (red) decisions at early RTs. In the experiment, the participant decided for the “right” alternative. The grey background shading is an interval defined by participant RT minus 95% quantile interval of the NDT. Black horizontal line is the bound. Here, the process is in the decision time frame (without NDT). (d) Same as (c) for ExaM. (e) Corresponding predicted RT distribution for DDM-equivalent model. Asterisk is participant response. The grey bar at the end indicates timed-out trials. (f) Same as (e) under ExaM. Green vertical lines in (a,b,e,f) indicates stimulus onset.

