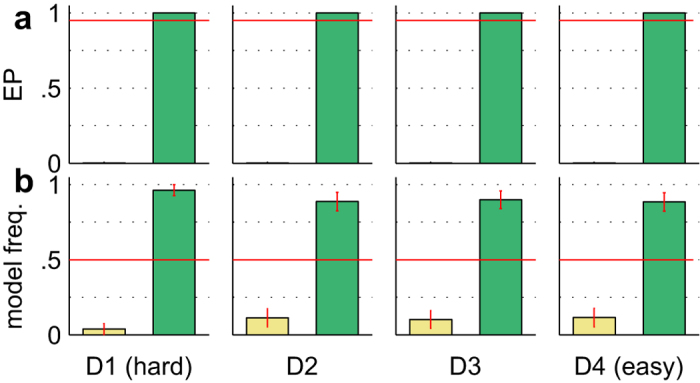
Figure 3. Bayesian Model Selection results for different input models with standard accumulation.

(a) Protected exceedance probability (EP) (belief of one model being more likely than any other model) between the DDM-equivalent model (yellow bars) and exact input model (green bars). The cut-off probability for the exceedance probability is typically set at 0.95 (red line). (b) Posterior model probability (expected probability of obtaining the model when randomly selecting a participant). The red line is the null frequency profile over models, i.e., chance frequency level28. Error bars are standard deviation over participants.
