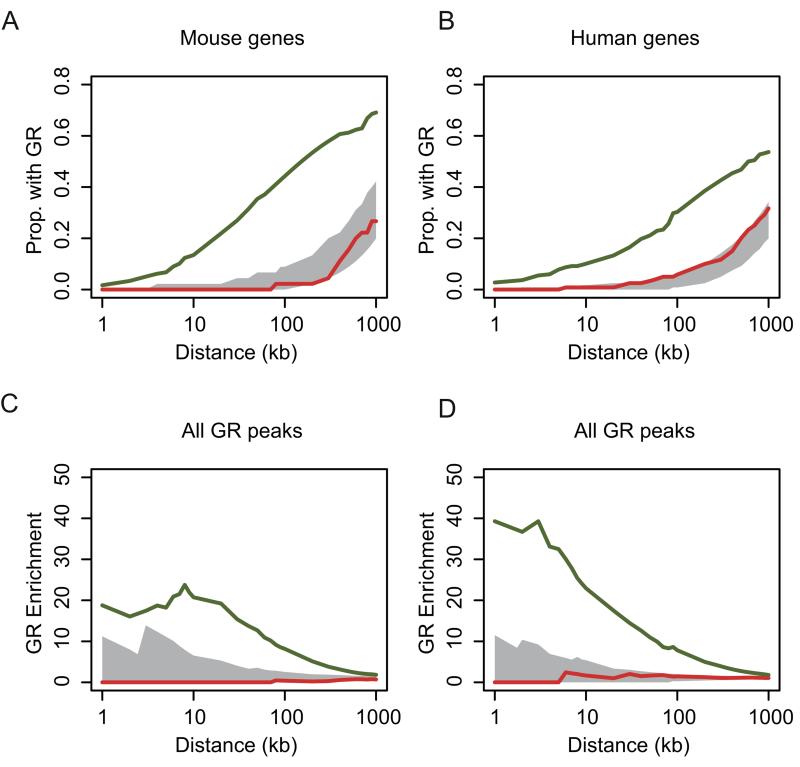
Figure 3. Induced genes are associated with GR binding.
(A and B) The proportion of GR ChIP peaks with induced (green line) or repressed (red line) gene promoters within a given genomic distance for (A) mBMDM and (B) hMDM. The 95% confidence intervals from matched genome permuted distributions of GR peaks are shown in grey. (C and D) Enrichment of the proportion of induced (green line) gene promoters with a GR peak within a given interval versus the proportion of induced genes without a GR peak (red line) within that interval for (C) mBMDM and (D) hMDM. No enrichment is seen for repressed genes (shown in red) The 95% confidence interval from a genome permuted distribution of GR peaks is shown in grey.

