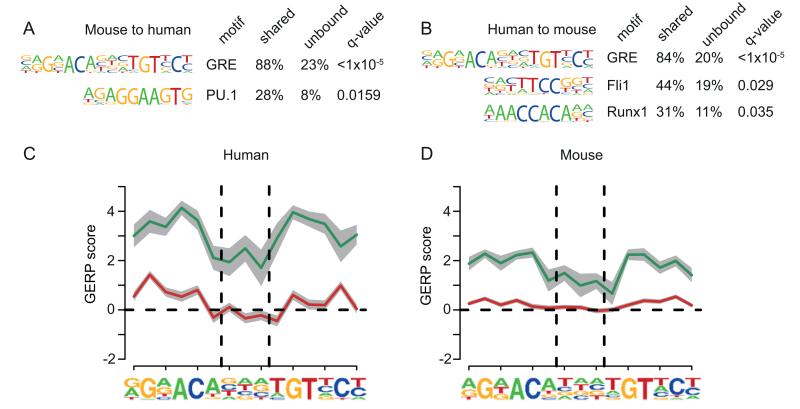
Figure 5. Conserved GR binding is linked to conservation of the GRE.
(A) Motif enrichment for the sites bound by GR in mBMDM that aligned and were also bound in hMDM, using as background the mouse sites that could be aligned to human but were not bound in hMDM (q values shown, Benjamini-Hochberg). (B) Analogous to (A) but for hMDM sites bound in mBMDM vs sites that could be aligned but were not bound in mBMDM. (C) Mean per base constraint scores calculated using GERP (72) across the GRE in shared (green) and species-specific (red) peaks found in hMDM, where the grey bars represents the standard error of the mean. Vertical dashed lines delineate the centre NNN for the GRE, as derived de novo from our hMDM data. (D) Analogous to (C) for GR bound peaks and GRE motif found in mBMDM.

