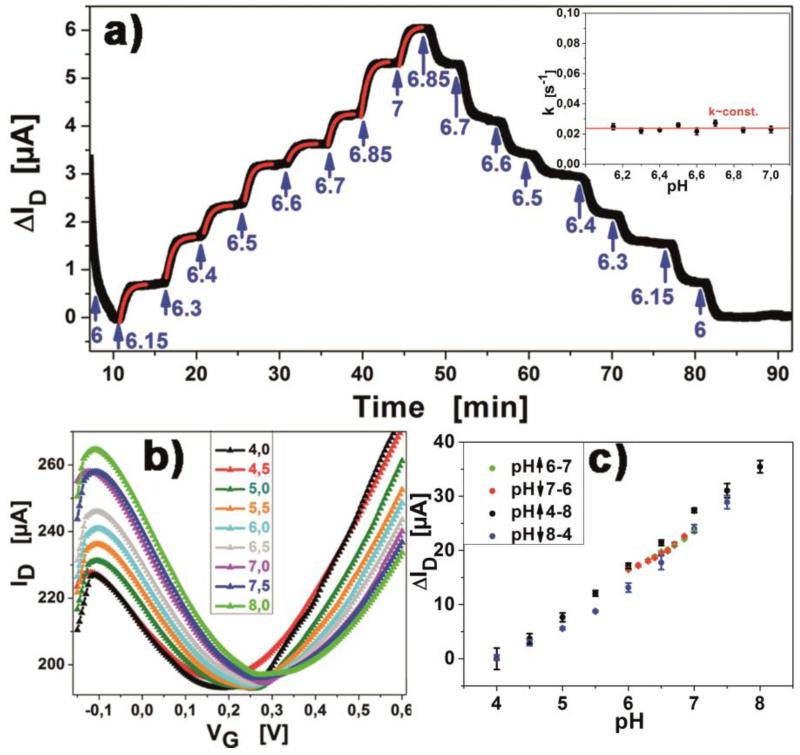
Figure 3.
a) Titration of the pH of the buffer from pH6 to pH7 in steps of ΔpH=0.1, showing reversibility of the measurements. Exponential fits (red lines) have been applied for each pH transition. Insert shows that transition rates are constant for varying pH. b) IDVG curves for pH values in the range pH 4-8, in steps of ΔpH=0.5. c) Regression of change in channel current with pH value. Arrows indicate if data was obtained from ascending or descending pH value titration.

