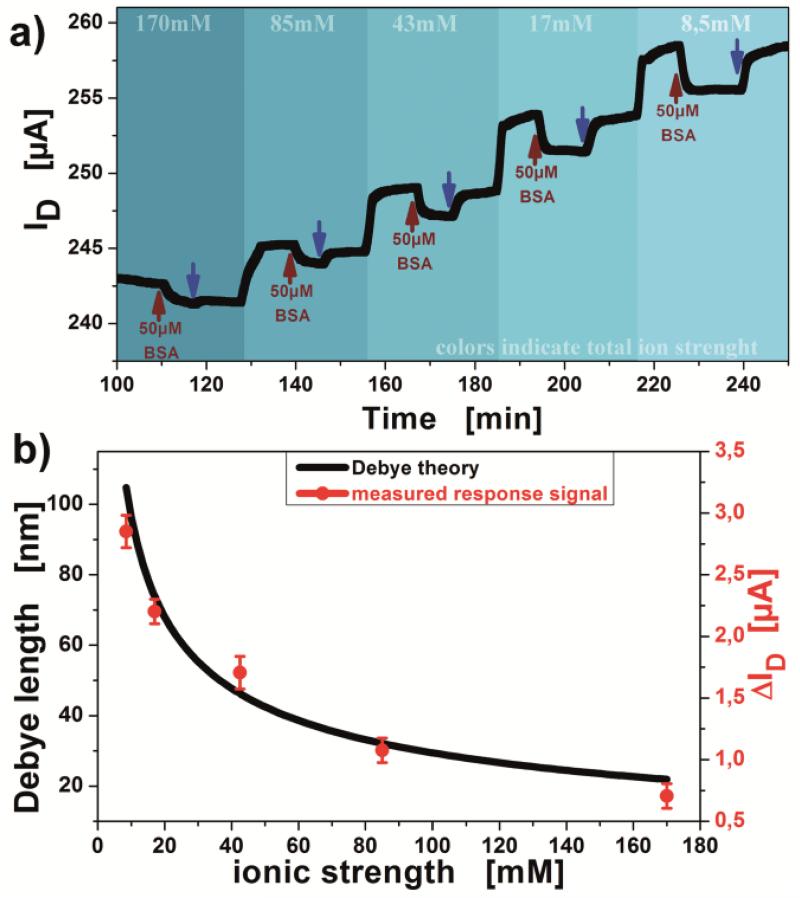
Figure 5.
a) Measurement of detection signal behavior for 50μM BSA, gradually decreasing the ionic strength (indicated by background color change) from 170mM to 8.5mM at VG= −0.2V. Blue arrows indicate wash-off with same buffer solution used for associated BSA injection. b) Overlap of responses from figure a) and the Debye-theory calculation.

