

Abstract
OBJECTIVES
To determine whether the increasing fall death rate among people aged 65 and older is due in part to temporal changes in recording the underlying cause of death.
DESIGN
Analyses of multiple cause of death data using the online Centers for Disease Control and Prevention Wide-ranging ON-line Data for Epidemiologic Research system, which uses the National Center for Health Statistics’ Multiple Cause of Death data set.
SETTING
United States, 1999 to 2010.
PARTICIPANTS
People aged 65 and older with a fall listed on their death record as the underlying or a contributing cause of death.
MEASUREMENTS
Circumstances and contributing causes off all deaths—records listing International Classification of Diseases, Tenth Revision, codes W00 to W19 as the underlying cause of death—and underlying causes for records with falls as a contributing cause were examined. Joinpoint regression analysis was used to assess trends in the proportion of fall and fall-associated deaths to total deaths for 1999 to 2010.
RESULTS
In 2010, there were 21,649 fall deaths and 5,402 fall-associated deaths among people aged 65 and older; 48.7% of fall deaths involved a head injury. Approximately half the fall death records included diseases of the circulatory system as contributing causes. From 1999 to 2010, there was a trend toward more-specific reporting of falls circumstances, although total deaths remained unchanged. The proportion of fall deaths to total deaths increased 114.3%, and that of fall-associated deaths to total deaths increased 43.1%.
CONCLUSION
The reasons behind the increasing older adult fall death rate deserve further investigation. Possible contributing factors include changing trends in underlying chronic diseases and better reporting of falls as the underlying cause of death.
Keywords: elderly, falls, fall deaths, ICD-10, vital records
Unintentional falls are a leading cause of death and the leading cause of death from injuries in older adults (≥65). From 1999 to 2010, the number of people aged 65 and older increased approximately 17%,1 the number of fall deaths more than doubled (from 10,097 to 21,649),2 and the age-adjusted unintentional fall death rate increased 78.2% (from 29.4 to 52.4 deaths per 100,000 older adults).2
National fall death rates are derived from death certificate data, which classify causes of death as contributing or underlying. Contributing causes of death are causes or conditions reported on the death certificate but not selected as the underlying cause. The World Health Organization (WHO) defines the underlying cause of death as the disease or injury that initiated the train of events leading directly to death or the circumstances of the accident or violence that produced the fatal injury.3 In the case of a death due to a traumatic injury, the cause of the injury should be considered the underlying cause. Organizations including the Centers for Disease Control and Prevention (CDC) and WHO typically use the underlying cause for tabulating mortality statistics.
The primary aim of this study was to determine the circumstances and multiple causes of deaths in which a fall was mentioned as the underlying or a contributing cause on the death certificate. It was hypothesized that the increasing fall death rate is due in part to temporal changes in recording falls as the underlying cause of death. Patterns in these data could inform further investigations into the principal factors contributing to the increasing older adult fall death rate.
METHODS
Multiple-cause-of-death data for 1999 through 2010 were analyzed using CDC Wide-ranging ON-line Data for Epidemiologic Research (WONDER), an online information system that allows a user to query data using menus.2 The National Center for Health Statistics (NCHS) publishes the Multiple Cause of Death (MCD) data set.4 State registries collect mortality data and provided them to the National Vital Statistics System. For each year of the 12-year period, every death record in WONDER MCD contained demographic and geographic characteristics, as well as the underlying cause of death, and room for up to 19 contributing causes of death. Since 1999, causes of death in the United States have been coded using the International Classification of Diseases, Tenth Revision (ICD-10).5
For 2010, the circumstances of unintentional fall deaths (fall deaths not self-inflicted or associated with violence; ICD-10 codes W00–W19) and the contributing causes associated with these deaths were examined. The underlying causes of fall-associated deaths, defined as records that included a fall as a contributing cause but not as the underlying cause, were also examined.
Trends from 1999 to 2010 in total deaths, the proportion of fall deaths to total deaths, the proportion of fall-associated deaths to total deaths, and age-adjusted fall death rates were analyzed. Trend analyses were conducted using Joinpoint analyses. The Joinpoint regression program tests whether a multisegmented line fits the data better than a straight line (Joinpoint Regression Program, version 3.3, National Cancer Institute, http://surveillance.cancer.gov/joinpoint/). Trends of the log of the outcome were analyzed to obtain the annual percentage change (APC) of line segments from the model estimates. P < .05 was considered statistically significant.
RESULTS
Circumstances of Fall Deaths
ICD-10 codes were examined to clarify the circumstances of fall deaths. Of the 21,649 unintentional fall deaths that occurred in 2010, 35.3% occurred from falling on the same level (W00, W01, W18) and 6.5% from falling on or from stairs and steps (W10) (Table 1). An additional 4.4% of falls involved furniture (W06–W08), such as falling when transferring (e.g., from the bed to a chair) or falling off furniture (e.g., after standing on a chair). The circumstances for 49.1% of fall deaths were not specified (W19).
Table 1.
Circumstances of Unintentional Fall Deathsa in Persons Aged 65 and Older: United States, 2010
| Circumstances of Fall | ICD-10 Code |
Deaths, n (% of Fall Deaths) |
|---|---|---|
| Fall on same level involving ice and snow |
W00 | 77 (0.4) |
|
| ||
| Same level from slipping, tripping, and stumbling |
W01 | 703 (3.2) |
|
| ||
| Fall involving sports, caused by collision, being pushed, or while being carried |
W02–W04 | 63 (0.3) |
|
| ||
| Fall involving wheelchair | W05 | 404 (1.9) |
|
| ||
| Fall involving furnitureb | W06–W08 | 956 (4.4) |
|
| ||
| Fall on and from stairs and steps | W10 | 1,402 (6.5) |
|
| ||
| Fall from a heightc | W11–W16 | 403 (1.9) |
|
| ||
| Other fall from one level to another |
W17 | 140 (0.6) |
|
| ||
| Other fall on same level | W18 | 6,869 (31.7) |
|
| ||
| Unspecified fall | W19 | 10,632 (49.1) |
|
| ||
| Total | 21,649 (100.0) | |
International Classification of Diseases, Tenth Revision (ICD-10) codes W00–W19.
Bed, chair, or other furniture.
On and from ladder or scaffolding; from, out of, or through a building or structure; from a tree or cliff; diving or jumping into water.
From 1999 to 2010, the percentage of deaths from falls on or from stairs and steps (W10) declined steadily from 10.3% to 6.5% (APC = –3.8%, test for trend, P < .001); falls from the same level from slipping, tripping, and stumbling (W01) also declined steadily from 5.4% to 3.2% (APC = –3.9%, P < .001) (data not shown). By contrast, from 1999 to 2002, the percentage of unspecified falls (W19) decreased quickly from 65.3% to 50.9% (APC = –7.2%, P = .001) and then decreased more gradually to 49.1% (APC = –0.8%, P = .02) (Figure 1). In comparison, from 1999 to 2001, the percentage of other falls on the same level (W18) increased sharply, from 5.3% to 22.4% (APC = 85.9%, P < .001) and then increased more slowly to 31.7% (APC = 5.4%, P < .001). Although these changes indicated a trend toward more-specific reporting of falls circumstances, they did not explain the increasing fall death rate.
Figure 1.
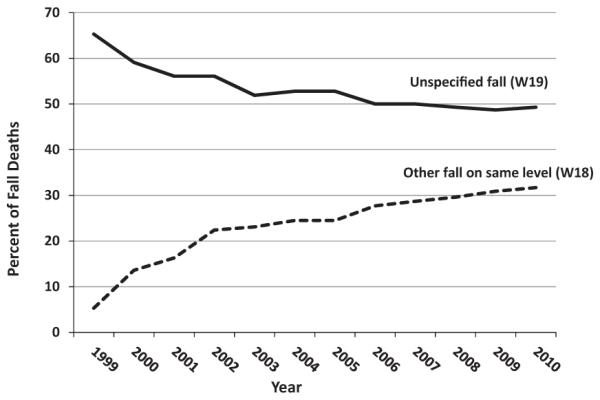
Changes in proportion of fall deaths according to circumstances, 1999–2010.
Fall as the Underlying Cause
In 2010, there were 21,649 fall death records containing a total of 88,831 multiple-cause-of-death ICD-10 codes; these included 21,687 external cause of injury codes for falls (W00–W19). After excluding the falls codes, 67,144 contributing cause codes remained. The mean number of contributing cause codes per death record increased gradually from 2.9 in 1999 to 3.1 in 2010, and the median number of cause codes was 3.0 for the entire time period.
The contributing causes of fall deaths for 1999 and 2010 were examined at the ICD-10 chapter level, as well as according to specific subchapters and individual codes for major injuries and diseases (Table 2). The output provided the number of deaths on the death certificate with at least one mention of the specified contributing cause category. Each fall death record included at least one nature of injury code (S00–T98); 91.4% of deaths in 2010 had injuries to one or more specific parts of the body reported (S00–S99), and 18.3% had injuries to multiple body regions or injuries from other external causes reported (T00–T98). Almost half of fall deaths involved head injuries, and 29.5% involved hip fractures. The other major contributors to fall deaths were diseases of the circulatory system (I00–I99) (47.4%) and diseases of the respiratory system (J00–J98) (17.4%). Within the category of circulatory diseases, 49.3% were attributed to hypertensive diseases (I10–I15) and 40.2% to ischemic heart diseases (I20–I25). Of the fall deaths associated with respiratory diseases, 25.0% involved pneumonia (J12–J18), and 42.1% involved chronic obstructive pulmonary disease (COPD) (J40–J44).
Table 2.
Contributing Causes Associated with Unintentional Falla Deaths among Persons Aged 65 and Older: United States, 2010 and 1999
| Contributing Cause of Deathb |
International Classification
of Diseases, Tenth Revision Chapter, Subchapter, or Individual Code |
Deaths in 2010, n (% within Category) |
Fall Deaths in 2010, %, n = 21,649 |
Fall Deaths in 1999, %, n = 10,097 |
|---|---|---|---|---|
| Injury to a specific body part | S00–S99 | 19,787 | 91.4 | 94.0 |
|
| ||||
| Head injury | S00–S09 | 10,535 (53.2) | 48.7 | 49.7 |
|
| ||||
| Hip fracture | S72 | 6,380 (32.2) | 29.5 | 32.0 |
|
| ||||
| Other injury | S10–S69, S70–S71, S73–S99 | 4,092 (20.7) | 18.9 | 17.7 |
|
| ||||
| Injury to multiple body regions and from other external causes |
T00–T98 | 3,966 | 18.3 | 21.5 |
|
| ||||
| Disease of the circulatory system | I00–I99 | 10,270 | 47.4 | 42.7 |
|
| ||||
| Hypertensive disease | I10–I15 | 5,060 (49.3) | 23.4 | 6.9 |
|
| ||||
| Ischemic heart disease | I20–I25 | 4,131 (40.2) | 19.1 | 16.2 |
|
| ||||
| Other circulatory diseass | I00–I09, I26–I99 | 5,253 (51.1) | 24.3 | 27.4 |
|
| ||||
| Disease of the respiratory system | J00–J98 | 3,764 | 17.4 | 17.7 |
|
| ||||
| Pneumonia | J12–J18 | 1,068 (28.4) | 4.9 | 7.0 |
|
| ||||
| Chronic obstructive pulmonary disease | J40–J44 | 1,583 (42.1) | 7.3 | 5.4 |
|
| ||||
| Other respiratory disease | J00–J11, J20–J39, J45–J98 | 1,469 (39.0) | 6.8 | 7.7 |
|
| ||||
| Mental and behavioral disorder | F01–F99 | 3,376 | 15.6 | 5.9 |
|
| ||||
| Symptoms, signs, and abnormal clinical and laboratory findings |
R00–R99 | 2,584 | 11.9 | 10.1 |
|
| ||||
| Endocrine, nutritional, and metabolic disease | E00–E89 | 2,345 | 10.8 | 7.4 |
|
| ||||
| Disease of the nervous system | G00–G98 | 1,685 | 7.8 | 8.3 |
|
| ||||
| Disease of the musculoskeletal system and connective tissue |
M00–M99 | 1,169 | 5.4 | 3.7 |
|
| ||||
| Disease of the genitourinary system | N00–N99 | 1,162 | 5.4 | 4.1 |
|
| ||||
| Neoplasm | C00–D48 | 1,028 | 4.7 | 4.4 |
|
| ||||
| Other cause | A00–B99, D50–D89, H00–H95, K00–K92, L00–L98, Q00–Q99, V01–V99, W20–Y89 |
2,016 | 9.3 | 12.0 |
W00–W19.
Categories are not mutually exclusive, so percentages add to more than 100.
The proportions of the major contributing causes to fall deaths in 1999 were similar to those in 2010, with the exception of hypertensive diseases and mental and behavioral disorders (Table 2). From 1999 to 2010, the proportion of fall deaths associated with these two categories increased substantially.
Fall as a Contributing Cause
There were 5,402 death records in which falls were listed only as a contributing cause (Table 3). For these fall-associated deaths, the leading underlying causes were diseases of the circulatory and respiratory systems. An example would be a situation in which a person suffered a heart attack and fell. Within the category of circulatory diseases, 57.2% of deaths were due to ischemic heart disease and 17.0% to hypertensive disease (data not shown). Within the category of respiratory disease, 72.2% of deaths were due to COPD (data not shown).
Table 3.
Underlying Causes of Death in Fall-Associateda Deaths among Persons Aged 65 and Older: United States, 2010
| Underlying Cause of Death |
International
Classification of Diseases, Tenth Revision Chapter Codes |
Deaths, n (% of Deaths) |
|---|---|---|
| Disease of the circulatory system |
I00–I99 | 2,877 (53.3) |
|
| ||
| Disease of the respiratory system |
J00–J98 | 550 (10.2) |
|
| ||
| Mental and behavioral disorder | F01–F99 | 444 (8.2) |
|
| ||
| Disease of the nervous system | G00–G98 | 403 (7.5) |
|
| ||
| Neoplasm | C00–D48 | 341 (6.3) |
|
| ||
| Disease of the musculoskeletal system and connective tissue |
M00–M99 | 159 (2.9) |
|
| ||
| Endocrine, nutritional, and metabolic disease |
E00–E88 | 149 (2.8) |
|
| ||
| Disease of the digestive system |
K00–K92 | 139 (2.6) |
|
| ||
| Disease of the genitourinary system |
N00–N98 | 132 (2.4) |
|
| ||
| Certain infectious and parasitic diseases |
A00–B99 | 126 (2.3) |
|
| ||
| Other | D50–D89, L00–L98, Q00–Q99, R00–R99, V01–Y89 |
82 (1.5) |
|
| ||
| Total | 5,402 (100.0) | |
Fall as a contributing but not the underlying cause.
Trends in Falls
From 1999 to 2010, the total number of deaths from all causes in persons aged 65 and older remained relatively constant (P = .18), whereas the number of fall deaths increased 114.4% (APC=7.4%, test for trend, P < .001), and the age-adjusted fall death rate increased 78.2% (1999–2004, APC = 7.2%, P < .001; 2004–2010, APC = 4.5%, P < .001) (Table 4). Consequently, the proportion of fall deaths to total deaths increased 114.3% (1999–2007, APC = 8.3%, P < .001; 2007–2010, APC = 4.9%, P = .008). The proportion of fall-associated deaths to total deaths rose 43.1%, increasing from 1999 to 2005 (APC 5.7%, P < .001) and then leveling off (P = .07).
Table 4.
Changes in Numbers and Percentages of Fall and Fall-Associated Deaths and Death Rates in Persons Aged 65 and Older, United States, 1999–2010
| Deaths | 1999 | 2000 | 2001 | 2002 | 2003 | 2004 | 2005 | 2006 | 2007 | 2008 | 2009 | 2010 | Change 1999–2010, % |
|---|---|---|---|---|---|---|---|---|---|---|---|---|---|
| Deaths, n | 1,797,331 | 1,799,825 | 1,798,420 | 1,811,720 | 1,804,373 | 1,755,669 | 1,788,189 | 1,759,423 | 1,755,567 | 1,799,830 | 1,761,937 | 1,798,276 | 0.1 |
|
| |||||||||||||
| Fall deaths,a n | 10,097 | 10,273 | 11,623 | 12,837 | 13,701 | 14,899 | 15,802 | 16,650 | 18,334 | 19,742 | 20,422 | 21,649 | 114.4 |
|
| |||||||||||||
| Fall-associated deaths,b n |
3,773 | 3,819 | 3,982 | 4,180 | 4,500 | 4,698 | 4,948 | 5,082 | 5,137 | 5,201 | 5,291 | 5,402 | 43.2 |
|
| |||||||||||||
| Fall deaths/total deaths |
0.56 | 0.57 | 0.65 | 0.71 | 0.76 | 0.85 | 0.88 | 0.95 | 1.04 | 1.10 | 1.16 | 1.20 | 114.3 |
|
| |||||||||||||
| Fall-associated deaths/total deaths |
0.21 | 0.21 | 0.22 | 0.23 | 0.25 | 0.27 | 0.28 | 0.29 | 0.29 | 0.29 | 0.30 | 0.30 | 43.1 |
|
| |||||||||||||
| Age-adjusted fall death ratesc |
29.4 | 29.6 | 33.0 | 36.0 | 37.8 | 40.6 | 42.3 | 43.7 | 47.0 | 49.6 | 50.2 | 52.4 | 78.2 |
Fall as the underlying cause of death.
Fall as a contributing cause but not the underlying cause.
CDC WONDER at http://wonder.cdc.gov/med.html
DISCUSSION
The aims of this study were to determine the circumstances and physiological causes of fall deaths. In 2010, there were 21,649 fall deaths, with approximately half involving head injuries. The most frequent contributing conditions were circulatory diseases (in large part hypertensive and ischemic heart diseases) and, to a lesser extent, respiratory disease (chiefly pneumonia and COPD). From 1999 to 2010, there was a trend toward more-specific reporting of falls circumstances, although the circumstances of almost half the 2010 fall deaths were not specified. During this decade, the number of deaths from all causes remained essentially unchanged, whereas the proportion of fall deaths to total deaths increased 114%, fallassociated deaths (falls only as a contributing cause) to total deaths increased 43%, and fall death rates increased 78%.
It had been expected that fall-related traumatic brain injury, which had been increasing,6 would be largely responsible for the increase in fall deaths and death rates and that anticoagulant use would be a contributing factor,7,8 but the proportion of fall deaths with a head injury as a contributing cause did not change substantially from 1999 to 2010. In contrast, the proportion of fall deaths with hypertensive disease as a contributing cause increased from 6.9% in 1999 to 23.4% in 2010. Medications used to treat hypertension, such as thiazide diuretics and beta blockers, have been associated with increased risk of falls.9,10 Hypertension also is associated with cognitive decline,11 and fall deaths with mental and behavioral disorders as contributing causes increased from 5.9% in 1999 to 15.6% in 2010. Cognitive disorders, such as Alzheimer’s disease, increase fall risk.12,13
In the case of death from a traumatic injury such as a fracture, the cause of the injury generally should be reported as the underlying cause. Therefore, to be categorized as a fall death, the underlying cause must be reported as a fall, such as death from head trauma sustained by a person who fell off a ladder. The increase in the proportion of fall deaths to total deaths might reflect greater recognition of falls in the sequence of events culminating in death, but identifying a fall death may not be straightforward. For example, if a person falls at home, fractures a hip, is hospitalized, develops pneumonia, and dies, pneumonia should be a contributing cause of death, and the fall should be the underlying cause; however, in the case of delayed death after a fall, accurate reporting can be challenging.
In 2010, one in five death certificates that mentioned a fall categorized the fall as a contributing rather than the underlying cause. For some of these records, the person certifying the cause of death may have misclassified the underlying cause of death. That is, although a fall may have initiated the chain of events leading to death, a concomitant illness, such as ischemic heart disease, was reported as the underlying cause. It is telling that cardiovascular disease frequently, and respiratory diseases to a lesser extent, were reported as contributing causes in fall deaths, as well as underlying causes in deaths in which a fall was a contributing cause. Cardiovascular disease, which can cause instability, postural dizziness, and temporary loss of consciousness (syncope), is an established risk factor for falls.14,15 In addition, immobility after a fall injury often can lead to pneumonia, a frequent contributing cause of death.
Understanding the circumstances surrounding fatal falls could help clarify the reasons for the increasing death rate. In 2010, information about falls circumstances was available for 11,017 (51%) fall death records. Approximately 70% of these resulted from falls on the same level, which is consistent with previous studies that have found that most falls occurred on a level surface when a person was walking or turning.16,17 A recent study, also using WONDER, reported that, from 1999 to 2007, the greatest increase in fall death rates occurred in the subgroup of falls on the same level (W18).18 These authors concluded that this category of falls was driving the increasing death rates, but they did not examine the changes in the proportion of fall deaths attributed to these circumstances. The current study found that the proportion of unspecified falls (W19) decreased, whereas the proportion of other falls on the same level (W18) increased, suggesting that more-precise reporting contributed to the increased rate for this category of falls.
Although better detection of falls may be influencing the increasing fall death rates, other explanations must be considered. There have been opposing trends in death rates for several chronic diseases strongly associated with falls. Between 1970 and 2002, death rates for heart disease declined 52%, whereas death rates for COPD doubled.19 Falls were frequently recorded as a contributing cause in cardiovascular deaths. It is likely that a decrease in heart disease deaths would produce a corresponding decrease in cardiovascular deaths with falls as a contributing cause. In contrast, approximately 16% of fall deaths were associated with pneumonia, a disease that is often attributed to immobility after a fall. In cases of death from pneumonia, falls might be more often recorded as the underlying cause and pneumonia as a contributing cause. The end result would be an increase in fall deaths.
There are some additional limitations that should be mentioned. A number of studies have noted problems in determining and reporting injury deaths.20,21 Another compared hospital discharge data with death certificate data and found that fall deaths were undercounted by 22%.22 This was attributed to clinicians not recognizing a fall as the original event that led to the subsequent pathology (e.g., pneumonia), classifying a death resulting from a fall as natural (e.g., intracranial hemorrhage), or focusing on preexisting medical conditions (e.g., cardiovascular disease) rather than on more-recent traumatic injuries from a fall.
Distinguishing between the underlying cause and contributing causes can be challenging for the person completing the death certificate. For example, did the individual fall and subsequently die from a cardiac event (fall as the underlying cause), or did the individual have a cardiac event and then fall (fall as a contributing cause)? Although this level of detail may be difficult to obtain, it is possible that correctly reporting falls as the underlying cause of death is improving. Better training is needed to help medical examiners and coroners complete death certificates more accurately.
Finally, data were not available on factors that might have affected the observed trends, such as changes in medication prescribing practices, changes in treatments for chronic conditions, and increasing frailty in the population aged 65 and older.
Although better reporting may contribute, the largest influence on fall death rates is probably the health of the rapidly aging population. U.S. life expectancy has increased,23 and people are living longer with chronic conditions such as diabetes mellitus, arthritis, and cardiovascular diseases. Along with advancing age, these conditions14,15,24,25 and the medications used to treat them26,27 can reduce older adults’ functional abilities and increase their risk of falling. Such frail older adults are more likely to die if they experience a fall injury.
The MCD data used in this study were derived from vital statistics that all states collect in a standardized manner and are virtually complete,28 but vital statistics are obtained from death certificates that are subject to incomplete reporting or misclassification. The quality of these data depends on the information available to the coroner or medical examiner who completes the death certificate and how completely this information is reported. Despite these challenges, evidence suggests that falls are more likely to be undercounted than overcounted.22 In addition, the circumstances of approximately half of fall deaths were not specified. More-comprehensive and -detailed data are needed to better describe the circumstances of fall deaths.
To the knowledge of the authors, this is the first study to use MCD data to compare underlying and contributing causes of fall deaths, to examine temporal changes in reporting fall deaths, and to discuss how these changes may be contributing to the increasing fall death rate.
The fall death rate in older adults and the number of older adults at risk of falling are increasing. Specific reporting of falls circumstances using ICD-10 codes improved from 1999 to 2010. Of fall deaths that occurred in 2010, almost half involved head injuries, and approximately 30% involved hip fractures. The other major contributors to fall deaths were circulatory diseases and, to a lesser extent, respiratory diseases. Changes in death rates for underlying chronic diseases, as well as better recognition and reporting of falls as the underlying cause of death, may partially explain the rapidly increasing fall death rate.
ACKNOWLEDGMENTS
We would like to thank David Sleet, Tamara Haegerich, Arlene Greenspan, and Robert Anderson for their help in clarifying this complex and often confusing topic, as well as for their editorial assistance.
This work was supported by the CDC through intramural funding.
Footnotes
Conflicts of Interest: None.
Author Contributions: Stevens J.A.: study conception and design, data analysis and interpretation, manuscript preparation and revisions. Rudd R.A.: data analysis and interpretation, critical review, manuscript revisions.
Sponsor’s Role: None. The findings and conclusions in this report are those of the authors and do not necessarily represent the official position of the CDC.
REFERENCES
- 1.U.S. Census Population Estimates [on-line] Available at http://www.census.gov/popest/data/historical/index.html Accessed February 27, 2013.
- 2.CDC WONDER Multiple Cause of Death Data [on-line] Available at http://wonder.cdc.gov/mcd.html Accessed February 10, 2013.
- 3.International Statistical Classification of Diseases and Related Health Problems. Vol. 2. World Health, Organization; Geneva: 2004. [Google Scholar]
- 4.U.S. National Center for Health Statistics National Vital Statistics Reports, Deaths: Preliminary Data for 2010. 60(4) January 2012 [on-line]. Available at www.cdc.gov/nchs/data/nvsr/nvsr60/nvsr60_04.pdf Accessed April 2, 2013. [Google Scholar]
- 5.World Health Organization International Statistical Classification of Diseases and Related Health Problems, 10th Revision [on-line] Available at http://apps.who.int/classifications/icd10/browse/2010/en Accessed February 26, 2013.
- 6.Ramanathan DM, McWilliams N, Schatz P, et al. Epidemiological shifts in elderly traumatic brain injury: 18-year trends in Pennsylvania. J Neurotrauma. 2012;29:1371–1378. doi: 10.1089/neu.2011.2197. [DOI] [PubMed] [Google Scholar]
- 7.Mina AA, Knipfer JF, Park DY, et al. Intracranial complications of preinjury anticoagulation in trauma patients with head injury. J Trauma. 2002;53:668–672. doi: 10.1097/00005373-200210000-00008. [DOI] [PubMed] [Google Scholar]
- 8.Sarani B, Temple-Lykens B, Kin P, et al. Factors associated with mortality and brain injury after falls from the standing position. J Trauma. 2009;76:954–958. doi: 10.1097/TA.0b013e3181ae6d39. [DOI] [PubMed] [Google Scholar]
- 9.Gribbin J, Hubbard R, Gladman JRF, et al. Risk of falls associated with antihypertensive medication: Population-based case–control study. Age Ageing. 2010;39:592–597. doi: 10.1093/ageing/afq092. [DOI] [PubMed] [Google Scholar]
- 10.Simonson W, Han LF, Davidson HE. Hypertension treatment and outcomes in US nursing homes: Results from the US National Nursing Home Survey. J Am Med Dir Assoc. 2011;12:44–49. doi: 10.1016/j.jamda.2010.02.009. [DOI] [PubMed] [Google Scholar]
- 11.Birns J, Kalra L. Cognitive function and hypertension. J Human Hypertension. 2009;23:86–96. doi: 10.1038/jhh.2008.80. [DOI] [PubMed] [Google Scholar]
- 12.Van Doorn C, Gruber-Baldini AL, Zimmerman S, et al. Dementia as a risk factor for falls and fall injuries among nursing home residents. J Am Geriatr Soc. 2003;51:1213–1218. doi: 10.1046/j.1532-5415.2003.51404.x. [DOI] [PubMed] [Google Scholar]
- 13.Suttanon P, Hill KD, Said CM, et al. Balance and mobility dysfunction and falls risk in older people with mild to moderate alzheimer disease. Am J Phys Med Rehabil. 2012;91:12–23. doi: 10.1097/PHM.0b013e31823caeea. [DOI] [PubMed] [Google Scholar]
- 14.Carey BJ, Potter JF. Cardiovascular causes of falls. Age Ageing. 2001;30(Suppl 4):19–24. doi: 10.1093/ageing/30.suppl_4.19. [DOI] [PubMed] [Google Scholar]
- 15.Tan MP, Kenny RA. Cardiovascular assessment of falls in older people. Clin Interv Aging. 2006;1:57–66. doi: 10.2147/ciia.2006.1.1.57. [DOI] [PMC free article] [PubMed] [Google Scholar]
- 16.Nachreiner NM, Findorff MJ, Wyman JF, et al. Circumstances and consequences of falls in community-dwelling older women. J Womens Health. 2007;16:1437–1446. doi: 10.1089/jwh.2006.0245. [DOI] [PubMed] [Google Scholar]
- 17.Milat AJ, Watson WL, Monger C, et al. Prevalence, circumstances and consequences of falls among community-dwelling older people: Results of the 2009 NSW Prevention Baseline Survey. NSW Public Health Bull. 2011;22:43–48. doi: 10.1071/NB10065. [DOI] [PubMed] [Google Scholar]
- 18.Hu G, Baker SP. An explanation for the recent increase in the fall death rate among older Americans: A subgroup analysis. Public Health Rep. 2012;127:275–281. doi: 10.1177/003335491212700307. [DOI] [PMC free article] [PubMed] [Google Scholar]
- 19.Jemal A, Ward E, Hao Y, et al. Trends in the leading causes of death in the United States, 1970–2002. JAMA. 2005;294:1255–1259. doi: 10.1001/jama.294.10.1255. [DOI] [PubMed] [Google Scholar]
- 20.Cryer C, Gulliver P, Samaranayaka A, et al. New Zealand injury prevention strategy indicators of injury death: Are we counting all the cases? Report prepared for Ministry of Health [on-line] Available at http://ipru3.otago.ac.nz/ipru/ReportsPDFs/OR085.pdf Accessed June 2, 2012. [Google Scholar]
- 21.Betz ME, Kelly SP, Fisher J. Death certificate inaccuracy and under-reporting of injury in elderly people. J Am Geriatr Soc. 2008;56:2267–2272. doi: 10.1111/j.1532-5415.2008.02001.x. [DOI] [PubMed] [Google Scholar]
- 22.Koehler SA, Weiss HV, Shakir A, et al. Accurately assessing elderly fall deaths using hospital discharge and vital statistics data. Am J Forensic Med Pathol. 2006;27:30–35. doi: 10.1097/01.paf.0000202710.06605.20. [DOI] [PubMed] [Google Scholar]
- 23.U.S. Census Births, Deaths, Marriages, & Divorces: Life Expectancy. Available at http://www.census.gov/compendia/statab/cats/births_deaths_marriages_divorces/life_expectancy.html Accessed April 2, 2013.
- 24.Schwartz AV, Hillier TA, Sellmeyer DE, et al. Older women with diabetes have a higher risk of falls: A prospective study. Diabetes Care. 2002;25:1749–1754. doi: 10.2337/diacare.25.10.1749. [DOI] [PubMed] [Google Scholar]
- 25.Sturnieks DL, Tiedemann A, Chapman K, et al. Physiological risk factors for falls in older people with lower limb arthritis. J Rheumatol. 2004;31:2272–2279. [PubMed] [Google Scholar]
- 26.Woolcott JC, Richardson KJ, Wiens MO, et al. Meta-analysis of the impact of 9 medication classes on falls in elderly persons. Arch Intern Med. 2009;169:1952–1960. doi: 10.1001/archinternmed.2009.357. [DOI] [PubMed] [Google Scholar]
- 27.Berlie HD, Garwood CL. Diabetes medications related to an increased risk of falls and fall-related morbidity in the elderly. Ann Pharmacother. 2010;44:712–717. doi: 10.1345/aph.1M551. [DOI] [PubMed] [Google Scholar]
- 28.National Vital Statistics System [on-line] Available at http://www.cdc.gov/nchs/nvss/about_nvss.htm Accessed February 27, 2013.