
Figure 7.
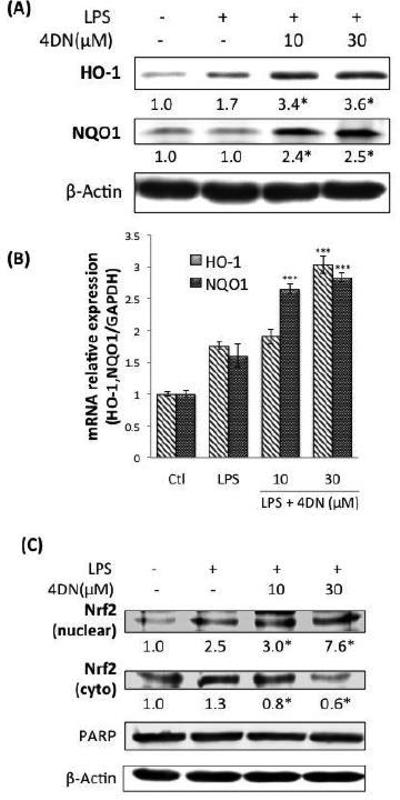
Effects of 4DN on protein and gene expression of anti-oxidative enzymes HO-1 and NQO1 in LPS-stimulated RAW 264.7 macrophages. The cells were seeded in 10-cm dishes for 24 hours, and then treated with LPS or LPS plus 4DN at concentrations indicated in the figure. After 24 h of incubation, cells were harvested for western immunoblotting as described in Methods. The numbers underneath of the blots represent band intensity (normalized to β-actin, means of 3 independent experiments) measured by Image J software. The standard deviations (all within ±15% of the means) were not shown. β-Actin was served as an equal loading control. *indicates statistical significance from the LPS-treated positive control group (p < 0.05, n = 3). (B) The cells were treated with LPS or LPS plus 4DN at concentrations indicated in the figure. After 24 h of incubation, total RNA was subjected to quantitative real-time RTPCR. Relative HO-1 and NQO1 mRNA expression (2−ΔΔCt) was determined by real-time PCR and calculated by the Ct value for HO-1 and NQO1 from GAPDH mRNA. Each value represents the mean ± SD of three independent experiments. *p < 0.05, **p < 0.01, and ***p < 0.001 indicate statistically significant differences from the LPS-treated positive control group. (C) Effects of 4DN on nucler translocation of Nrf2 in RAW 264.7 macrophages. The cells were seeded in 10-cm dishes for 24 h, and then treated with LPS or LPS plus 4DN at concentrations indicated in the figure. After 24 hours of incubation, cytoplasmic and nuclear fractions were prepared for western immunoblotting as described in Methods. The numbers underneath of the blots represent band intensity (normalized to PARP or β-actin, means of three independent experiments) measured by Image J software. The standard deviations (all within ±15% of the means) were not shown. PARP and β-Actin were served as an equal loading control. *indicates statistical significance from the LPS-treated group (p < 0.05, n = 3).