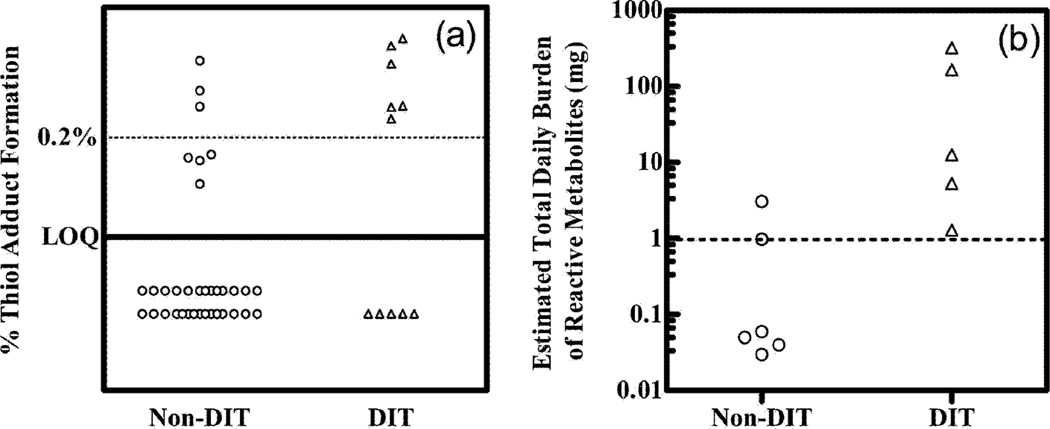
Fig. 8.
Scatter plots of (A) percentage GSH adduct formation and (B) estimated total daily covalent adduct burden in “drug-induced toxicity” (DIT, Δ) and non-drug-induced toxicity (Non-DIT, O) groups of chemicals.60) Horizontal lines are drawn at a (A) 0.2% adduct level and (B) 1 mg body level.

