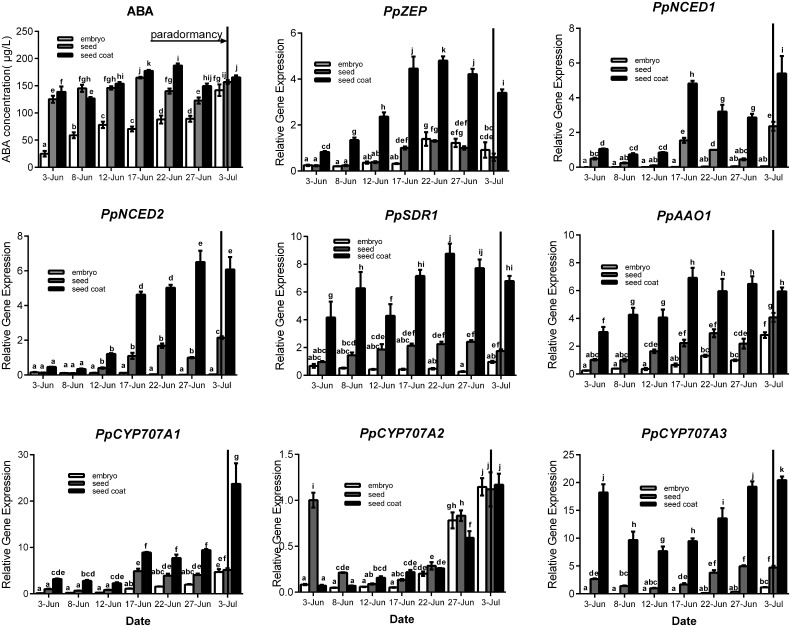
Figure 4.
Relative expression levels of eight ABA metabolic genes in seeds, seeds coat, and embryos during the period of seed development from 3 June to 3 July in 2015. Seeds were sampled every 5 days. Expression levels were calculated relative to a peach β-actin as Figure 3, and data are presented as the means ± standard errors. Each experiment was performed three times. Different letters above bars indicate a significant difference among chilling periods according to ANOVA and Duncan's test (P < 0.05). In addition, the period of seeds development [paradormancy (induction of seed dormancy)] corresponds to buds paradormancy (induction of bud dormancy). The lines have the same meaning.

