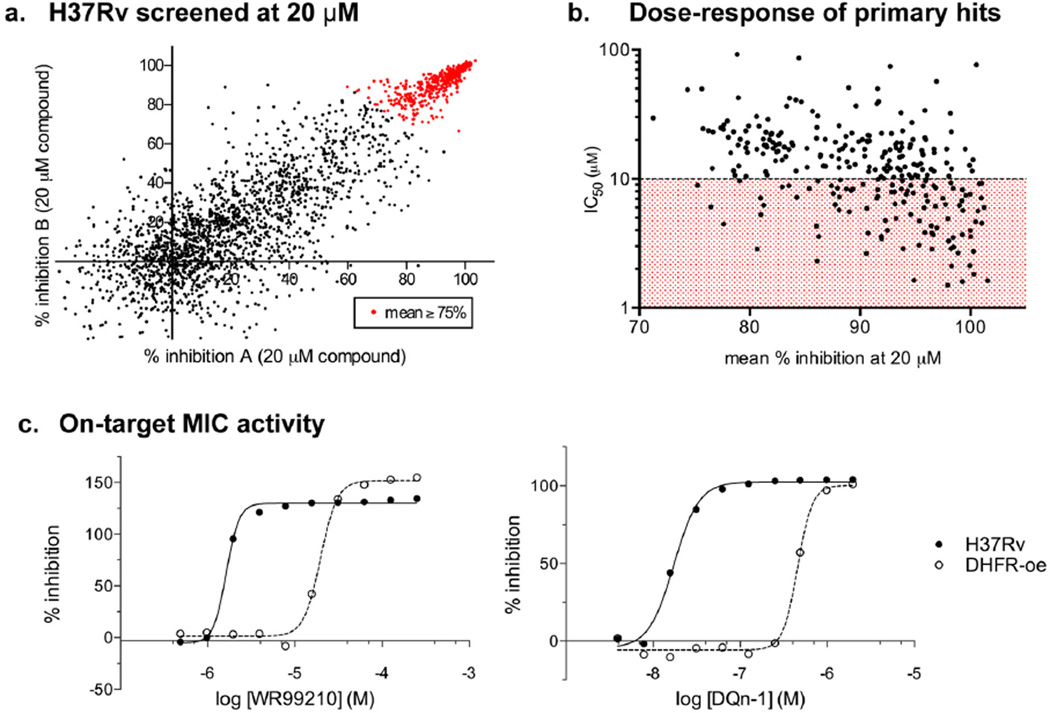
Figure 2.
Sreening antifolates against Mtb. (a) 2724 compounds were tested at 20 µM against live H37Rv. The percent inhibition measured in two separate assays is plotted on the x- and y-axes for each compound. (b) Active inhibitors were assayed at 11 concentrations ranging from 100 to 0.098 µM, and the concentration required for 50% growth inhibition (IC50) was calculated. Average activity of duplicate experiments from (a) was plotted on the x-axis, and calculated IC50 values were plotted on the y-axis). Compounds with IC50 values under 10 µM are in the red-shaded area of the graph. (c) Growth inhibition curves are shown for compounds from two of the five chemotypes identified in the screen, namely, WR99210 (left graph) and DQn-1 (right graph). Compounds were assayed against wild-type Mtb (H37Rv shown as solid circles) and Mtb engineered to artificially overexpress DHFR (DHFR-oe shown as clear circles). Data shown are the average of duplicate experiments.

