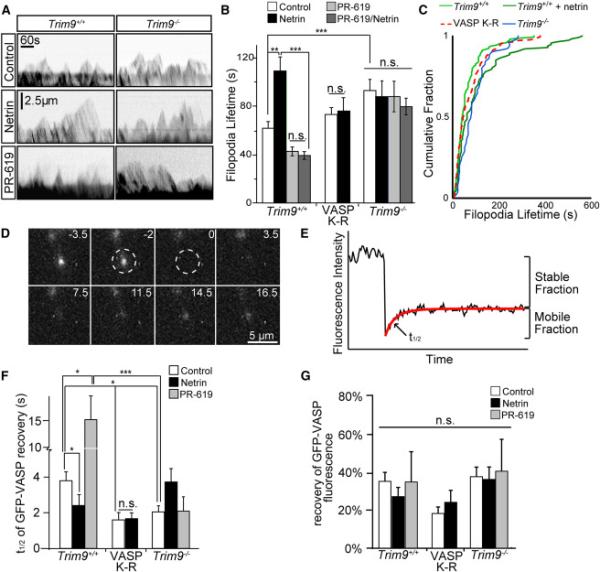
Figure 6. Ubiquitination of VASP reduces filopodia lifetime and the rate of VASP dissociation from filopodia tips.

A) Example kymographs of axonal growth cone filopodia from TRIM9+/+ and TRIM9−/− neurons expressing mCherry. B) Filopodial lifetimes +/−SEM in control, netrin, and PR-619 treated TRIM9+/+ and TRIM9−/− neurons and TRIM9+/+ neurons expressing GFP-VASP K-R. C) Cumulative fraction plot of filopodial lifetime demonstrating intermediate phenotype of VASP K-R expressing neurons. D) Image montage of GFP-VASP FRAP at a filopodium tip. Bleach denoted by dashed region, time before and after bleaching in seconds. E) Example of fluorescence intensity data fit to a single exponential (red line), depicting percent fluorescence recovery and t1/2 of fluorescence recovery. F) Fluorescence recovery halftime (t1/2) +/−SEM and G) mean % fluorescence recovery +/−SEM for indicated conditions. (See also Movies S4, S5, FigS6). VASP K-R was expressed in TRIM9+/+ neurons. (See also FigS6)
