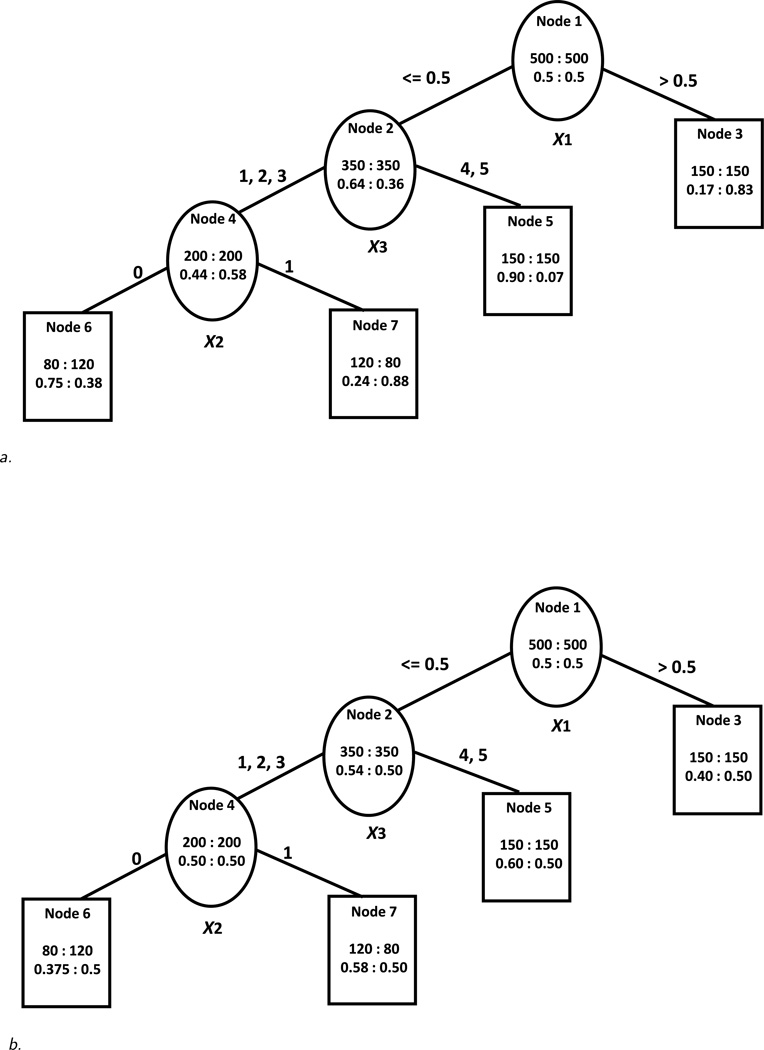
Figure 1.
a. Tree structure for the scenario with sizeable treatment-covariate interactions. Within each node, the top number represents a total number of subjects in treatment group A:B and the bottom number stands for a percentage of subjects in A:B who have a response. The splitting variable is shown underneath each internal node. The splitting value or category is shown above the solid line connecting the parent node to the left or right daughter node.
b. Tree structure for the scenario with small treatment-covariate interactions. Within each node, the top number represents a total number of subjects in treatment group A:B and the bottom number stands for a percentage of subjects in A:B who have a response. The splitting variable is shown underneath each internal node. The splitting value or category is shown above the solid line connecting the parent node to the left or right daughter node.

