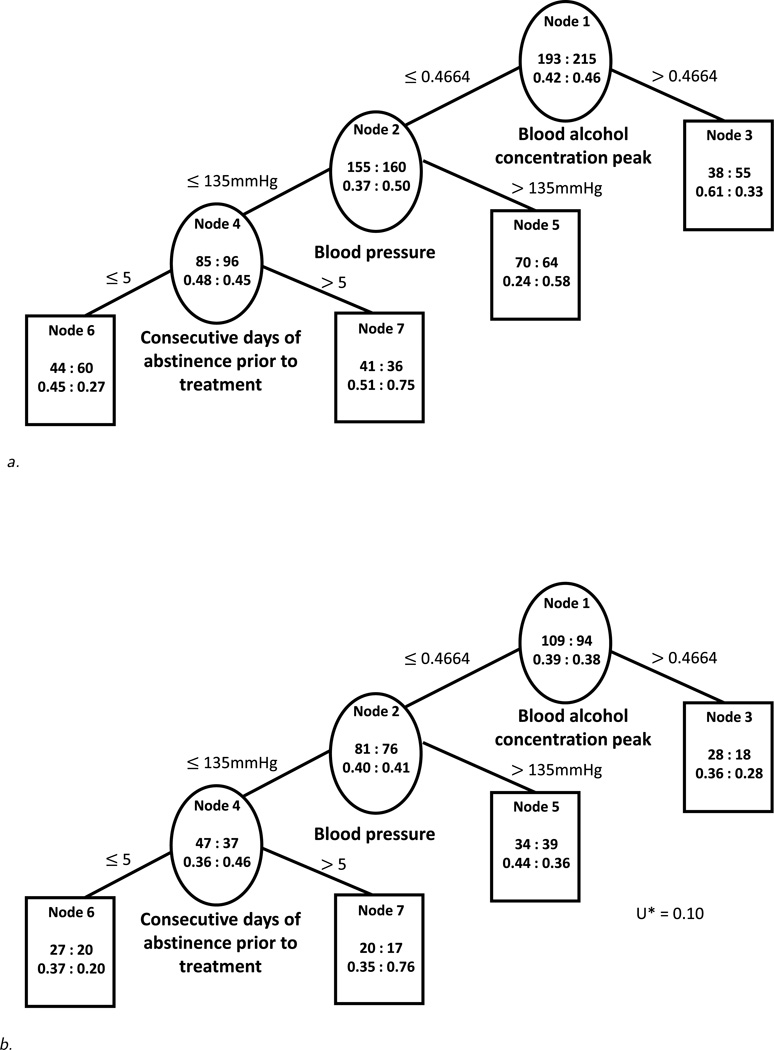
Figure 3.
a. Constructed tree using the proposed algorithm based on the training sample from the COMBINE study. Within each node, the top number on the left: right side represents the total number of patients in the acamprosate: naltrexone group, and the bottom number stands for a percentage of subjects with no heavy drinking in the acamprosate: naltrexone group.
b. Constructed tree from training sample (Figure 3a) evaluated on the validation sample from the COMBINE study. Within each node, the top number on the left: right side represents the total number of patients in the acamprosate: naltrexone group, and the bottom number stands for a percentage of subjects with no heavy drinking in the acamprosate: naltrexone group.

