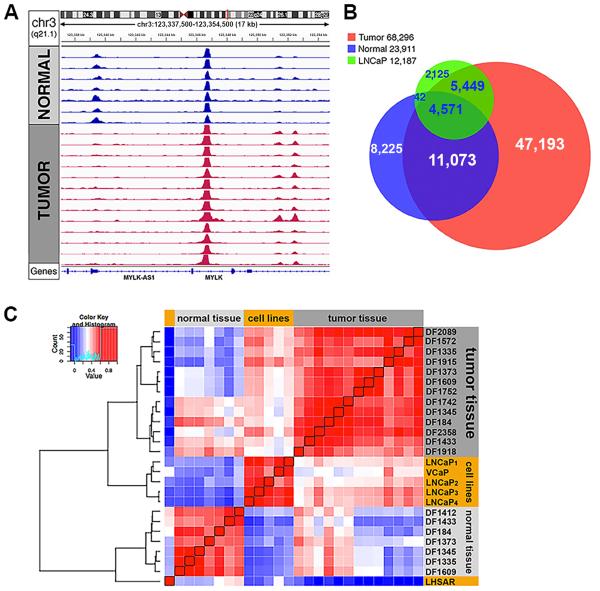
Fig. 1. Genome-wide androgen receptor (AR) binding in normal prostate epithelium and tumor tissue.
A. Representative 17 kilobase (kb) area. Each track depicts ChIP-seq AR binding intensity for a given sample. This locus demonstrates common AR binding sites as well as tissue-specific sites. B. Unique AR sites by tissue-type across all cohort samples and LNCaP prostate cancer cell line. C. Unsupervised pair-wise correlation of AR cistromes between all specimens as well as prostate cell lines. Cell lines include one LNCaP (LNCaP1) and one LHSAR dataset generated for this analysis, and four publicly available datasets - three LNCaP11,16,18 and one VCaP17. Hierarchical clustering demonstrates relatedness of each AR cistrome. Black diagonal denotes the line of identity.

