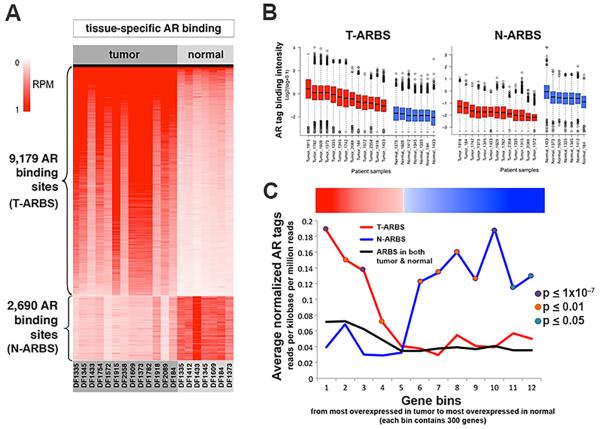
Fig. 2. Tissue-specific AR binding sites.
A. Each horizontal line represents an AR site with significantly differential binding intensity across tissue-types (RPM, reads per million). Each column depicts binding intensity for an individual specimen (T-ARBS, tissue-specific AR binding sites; N-ARBS, normal prostate epithelium AR binding sites). B. Box and whisker plots depicting the median, 25th–75th percentile and extremes of AR binding intensity across all specimens in tissue-specific sites. C. 3743 genes from the TCGA dataset with tissue-specific increased expression were ranked by fold-change and binned into groups of 300 (x-axis). The y-axis shows the average of normalized AR tags within 50kb of these genes.

