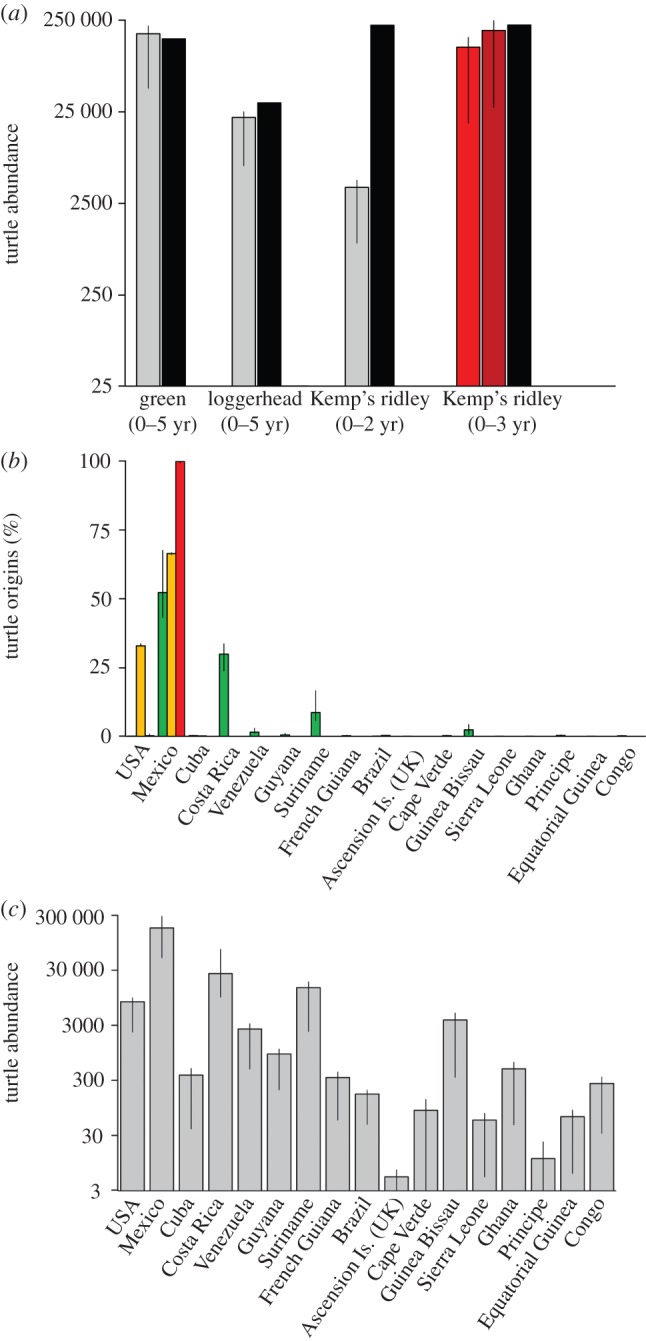
Figure 2.

Predictions of turtle abundance and population sources at the spill site. (a) Grey bars show turtle abundance predicted by passive transport simulations. Red bars are results for Kemp's ridley simulations depicting ‘retentive behaviour’ within the spill site (lighter red) and across the northeastern Gulf of Mexico (darker red). Error bars indicate results obtained when using the minimum and maximum values of oceanic-stage survival. The black bar is the estimate from in-water observations [6]. (b) Percentage of green (green), loggerhead (yellow) and Kemp's ridley (red) turtles at the spill site by country of origin (error bars as in a). (c) Predicted total turtle abundance at the spill site by country of origin (error bars as in a).
