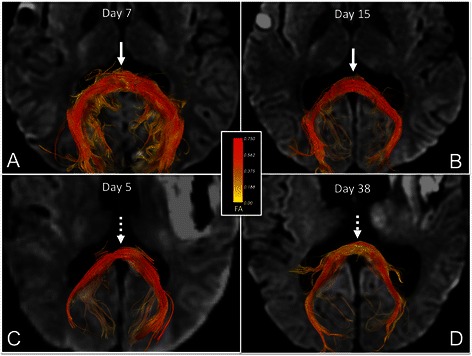
Fig. 3.

Longitudinal changes in fiber tract FA in the splenium of the corpus callosum. Superior view of acute (a) and subacute (b) fiber tracts of the splenium of the corpus callosum (CC) in a patient with good outcome (DRS = 1). Fiber tracts are color-coded according to mean FA (center inset) so that longitudinal splenium FA changes in each patient can be observed. Superior view of acute (c) and subacute (d) fiber tracts of the splenium of the CC in a patient with poor outcome (DRS = 8.5). In the patient with good outcome, splenium FA values are high in both the acute and subacute periods, as indicated by the red tract colors (solid arrows). In the subject with poor outcome, splenium FA values decline from the acute to the subacute period, as indicated by the red tracts in the acute period as compared to yellow tracts in the subacute period (dotted arrows). All tracts were reconstructed using Diffusion Toolkit version 0.6.2 and virtually dissected by manually tracing a splenium ROI in TrackVis version 5.2 (Wang & Wedeen, Athinoula A. Martinos Center for Biomedical Imaging, www.trackvis.org). Fiber tracts from the fornix and optic radiations were excluded to isolate the splenium fiber tracts. Tracts are superimposed on axial diffusion-weighted images at the level of the inferior aspect of the splenium of the CC
