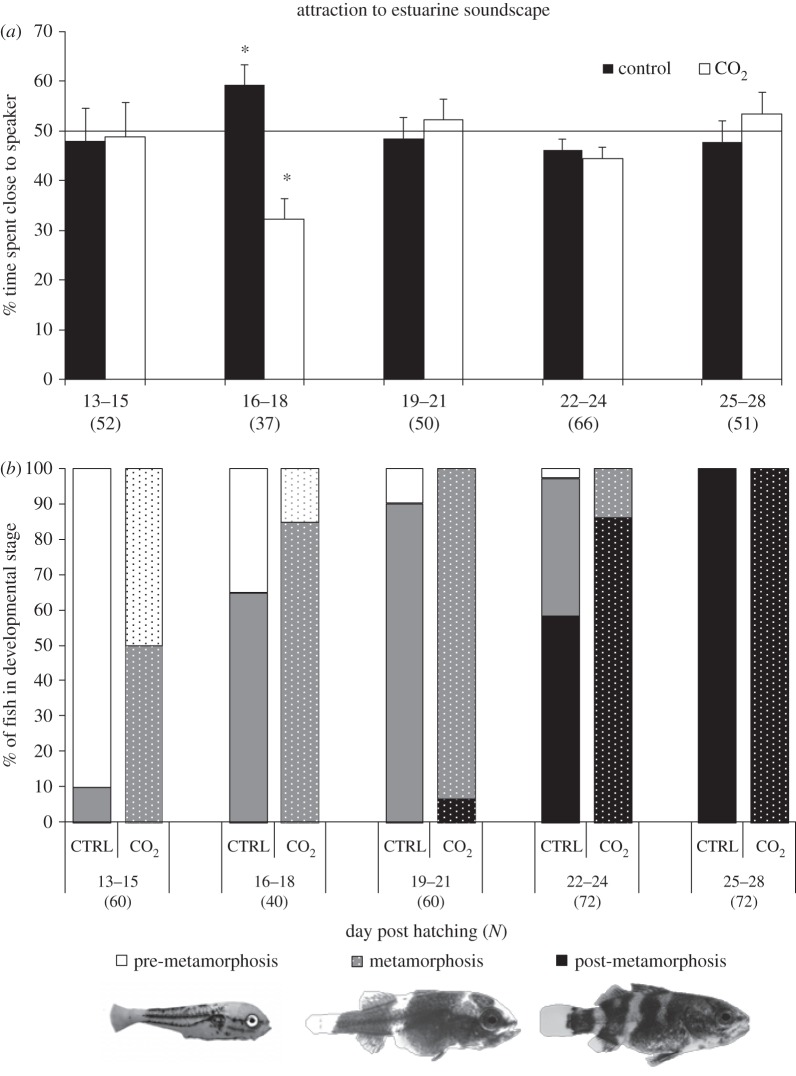
Figure 1.
Effect of ocean acidification on fish auditory preferences throughout larval development. (a) Mean (+s.e.) percentage of time spent in the half of the chamber closest to the speaker broadcasting an estuarine soundscape. Results are pooled in blocks of 3 days. Stars indicate statistically significant differences relative to a 50% threshold for random response represented by the horizontal bar. (b) Proportion of fish in each developmental stage as a function of number of dph. Results are pooled in blocks of 3 days. The elevated CO2 treatment is represented by dotted bars. Number of replicates for each 3-day block is reported in parentheses.

