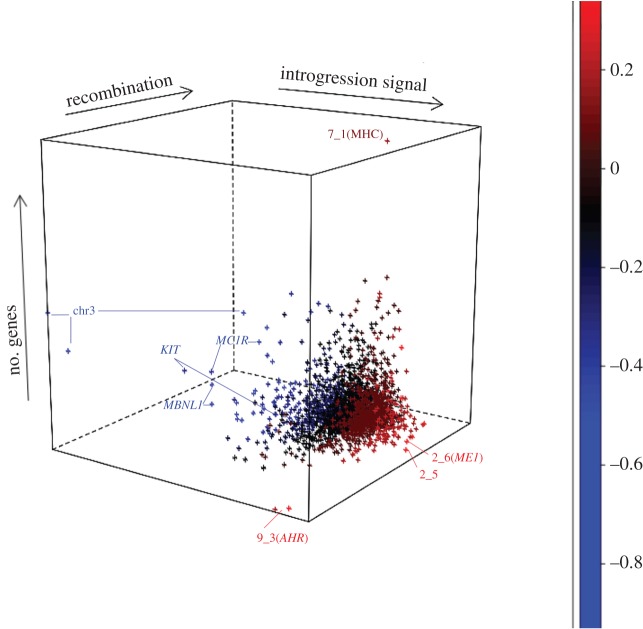
Figure 2.
rIBD and genome characteristics. For each 1 Mb bin in the genome, the rIBD signal was plotted against the number of genes and the recombination frequency in the bin. Colouration is based on the rIBD signal so that bright red indicates bins with the strongest Asian introgression signal, and blue bins indicate the strongest under-representation of AS. Number of genes per bin ranged from 0 to 128 and recombination frequency ranged from −16.6 to 3.3 (log2-transformed) cM/Mb. Bins containing interesting genes that are discussed in the main text are indicated.

