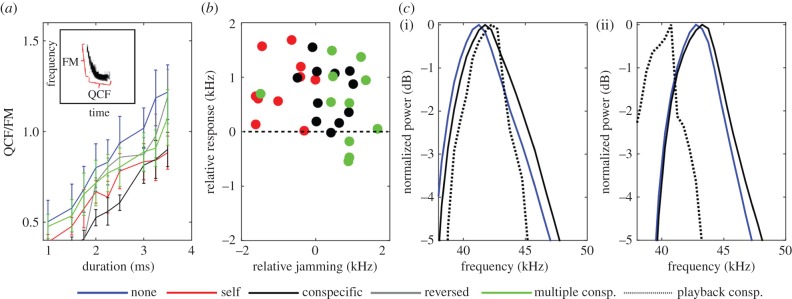
Figure 5.
Call design and spectral response to jamming. (a) QCF/FM duration ratio (mean ± s.e.). Increasing pulse duration was mostly achieved by prolonging the QCF tail. (b) Spectral response for all bats in three jamming conditions. The shift in peak frequency (Y-axis) is presented as a function of the difference in peak frequency between the jamming signal and the own peak frequency of the bat (prior to jamming—X-axis). In almost all cases, the bats shifted upwards (31 out of 38), while in four cases they did not change their frequency and in only three they slightly decreased it. In contrast with the JAR prediction, there was no (negative) correlation between the jamming stimulus (X-axis) and the response (Y-axis). The panel shows 38 points in total—five call durations (between 2 and 3.5 ms) for four bats in three experimental conditions. Not all durations were present in all jamming sequences. (c) Bats shifted their call frequency content upwards when jammed by a signal with a higher frequency content ((i)—bat 1 jammed by bat 4) thus increasing spectral overlap, and when jammed by a signal with lower frequency content ((ii)—bat 4 by bat 3), thus decreasing spectral overlap. The mean call spectrum is presented before jamming (blue) and when jammed by one conspecific (black). Grey dashed line shows the jamming signal which was once higher (i) and once lower (ii).

