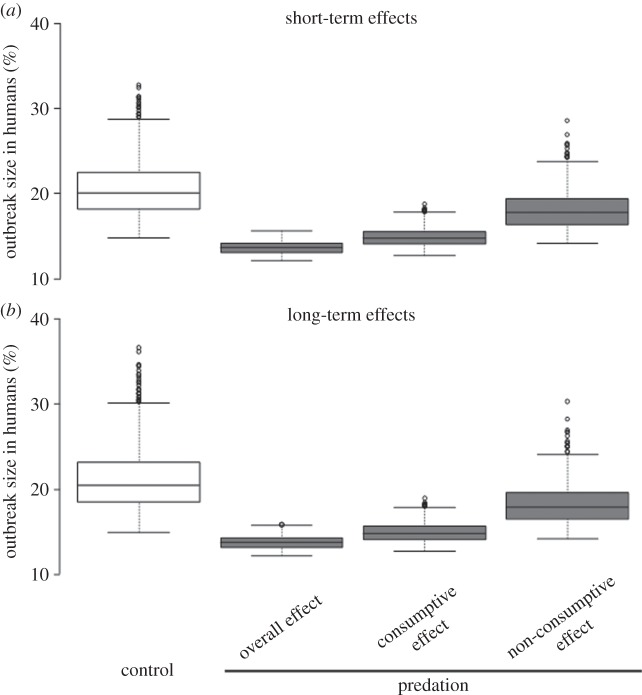
Figure 5.
(a,b) Theoretical difference in the distribution of outbreak sizes for predation and control groups at both short- and long-terms. Outbreak size is the proportion of humans that has been infected at the end of one (short-term) or 10 (long-term) transmission seasons, after one infectious human was introduced into the population. A first model fed with our experimental results (values listed in electronic supplementary material, table S1) was run. This model, including both consumptive and non-consumptive effects, predicts the overall effect of predation exposure on outbreak size. To account for consumptive effects only, the value of all parameters of the predation group was replaced in the model with those of control individuals, except the developmental success (i.e. the Y parameter in electronic supplementary material, table S1). To account for non-consumptive effects only, the value of the Y parameter of the predation group was replaced by that of the control group. The box plots indicate the median (large horizontal bars), the 25th and 75th percentiles (boxes), the minimum and maximum values (whiskers) and outliers (circles).

