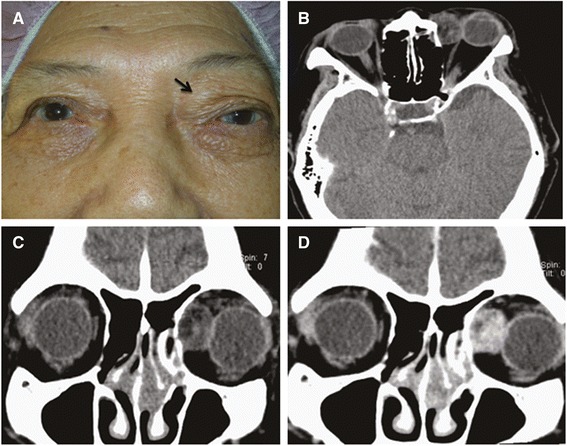
Fig. 1.

Preoperative photograph shows a palpable mass on left superonasal orbit (a, arrow). Axial (b) and coronal (c) planes of computed tomographic scan show a circumscribed soft tissue mass on the left superonasal orbit with heterogenic density containing areas of fat attenuation. The mass demonstrates heterogenous enhancement (d)
