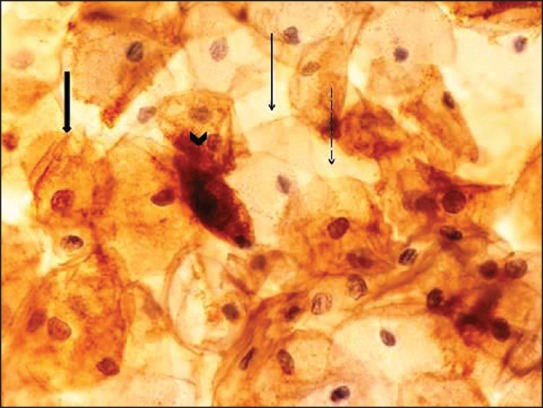
Figure 2.

Negative, weak, moderate, and strong Bak staining intensity (Bak stain, ×400). Negative, score 0 (thin arrow). Weak, score 1 (dashed arrow). Moderate, score 2 (wide arrow). Strong, score 3 (arrowhead). Staining features as described in Figure 1
