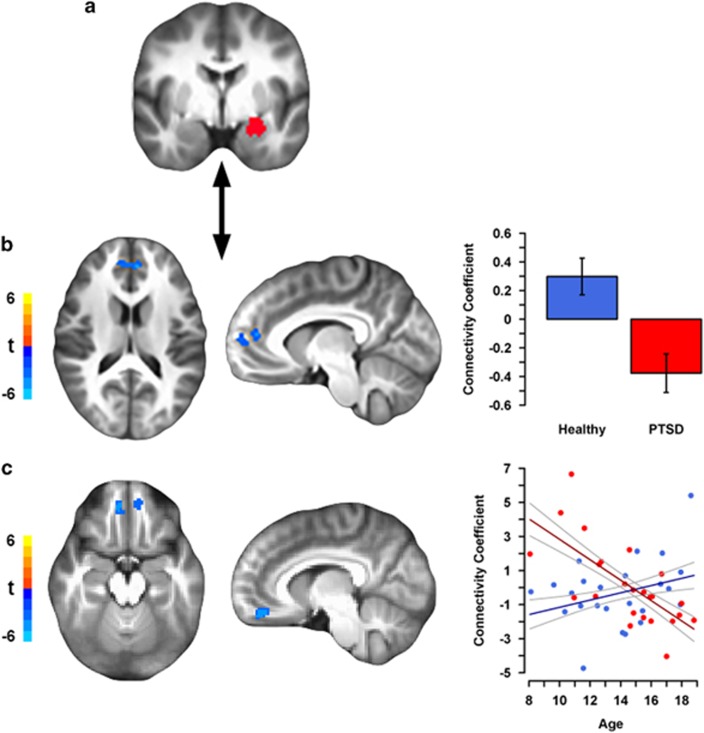
Figure 2.
Decreased prefrontal-amygdala connectivity to threat in pediatric posttraumatic stress disorder (PTSD) compared with healthy youth. (a) The left amygdala seed used in the psychophysiological interaction (PPI) analysis. (b) Reduced left amygdala–bilateral rostral anterior cingulate cortex (rACC)/dorsomedial prefrontal cortex (dmPFC) and –left dmPFC (visible in sagittal view) connectivity to threat vs neutral images in youth with PTSD. Data for bar graph come from the rACC/dmPFC cluster, although the left dmPFC plot is comparable. (c) Age-related differences in the left amygdala-bilateral ventromedial PFC (vmPFC) connectivity to threat vs neutral images in youth with PTSD compared with healthy youth. A group by age interaction revealed that age positively predicted amygdala–vmPFC connectivity in healthy youth but negatively predicted connectivity in youth with PTSD. The scatterplot is of connectivity coefficients from the right vmPFC cluster (results from the left vmPFC cluster are comparable). For each figure, axial and sagittal views of regional brain activation are shown on the left. Color bars correspond to the t-statistic value in each voxel. The left hemisphere is shown on the right side of the axial image. Plots of extracted average cluster connectivity coefficients for each effect are shown on the right, with healthy youth in blue and PTSD youth in red. Error bars/bands represent ±1 SE. Scatterplot points are raw data. Note that the voxelwise model included age, sex, and their interactions with group as factors.

