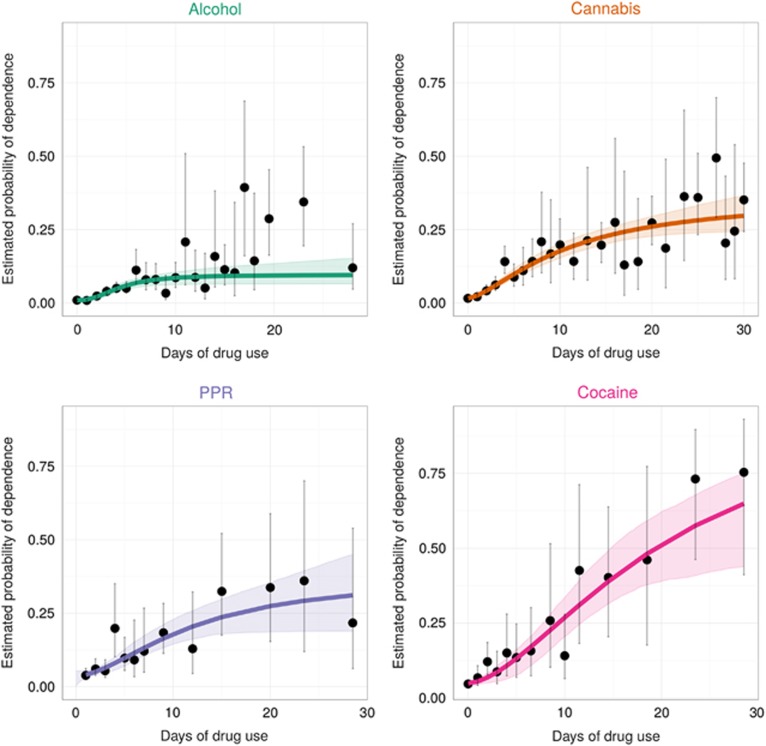
Figure 2.
Dots and vertical bars are observed empirical estimates for risk of drug dependence (DD) with the corresponding 95% confidence intervals (95% CI). Lines show estimated probability of having developed DD across drug-frequency strata, as estimated via nonlinear regression, and shaded regions show corresponding 95% bootstrap CIs. Data from newly incident drug users found in the United States National Surveys on Drug Use and Health, 2002–2011.

