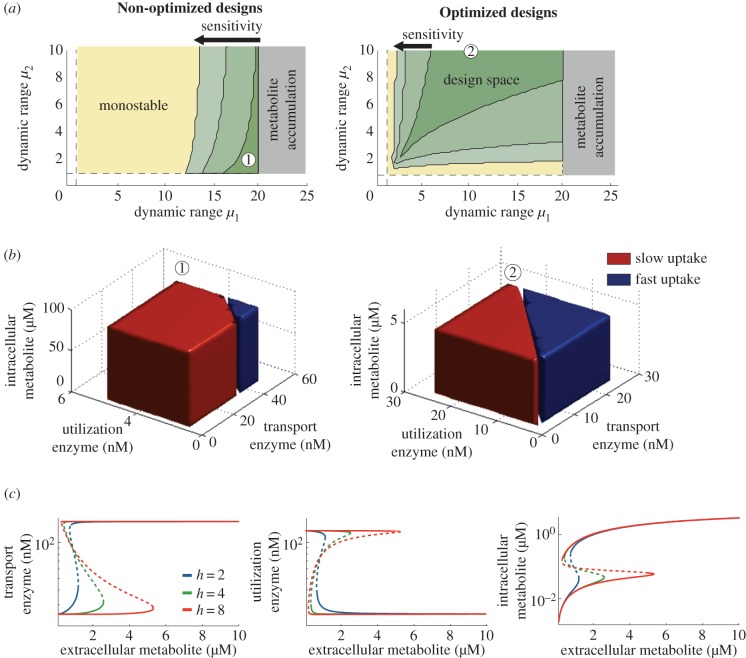
Figure 6.
Bistability in the activation-repression circuit. (a) Regions for bistability in non-optimized and optimized designs for a continuous model of the activation-repression circuit (cf. figure 5). In the non-optimized designs, the regulatory threshold was chosen as θ = s0 for an extracellular metabolite concentration s0 = 4.7 µM; in the optimized designs, the threshold was chosen to maximize the region for bistability according to the criterion in (4.5) taken as equality; promoter sensitivities are h = {2, 4, 8}. (b) Domains of attraction of two specific designs with low-sensitivity promoters (h = 2) and promoter dynamic ranges (μ1, μ2) = (19, 2) and (μ1, μ2) = (10, 10), marked as and in panel (a). (c) Bifurcation diagrams of the enzyme concentrations and internalized metabolite as a function of the extracellular concentration; solid (dashed) lines indicate the stable (unstable) steady states. The design is optimized for a nominal concentration s0 = 1 µM according to (4.5) taken as equality, and promoter dynamic ranges (μ1, μ2) = (6, 5). The baseline enzyme expression levels were fixed to  in panels (a,b), and
  in panel (c). Details of the simulations and parameter values can be found in appendix A.2. (Online version in colour.)

