
Figure 7.
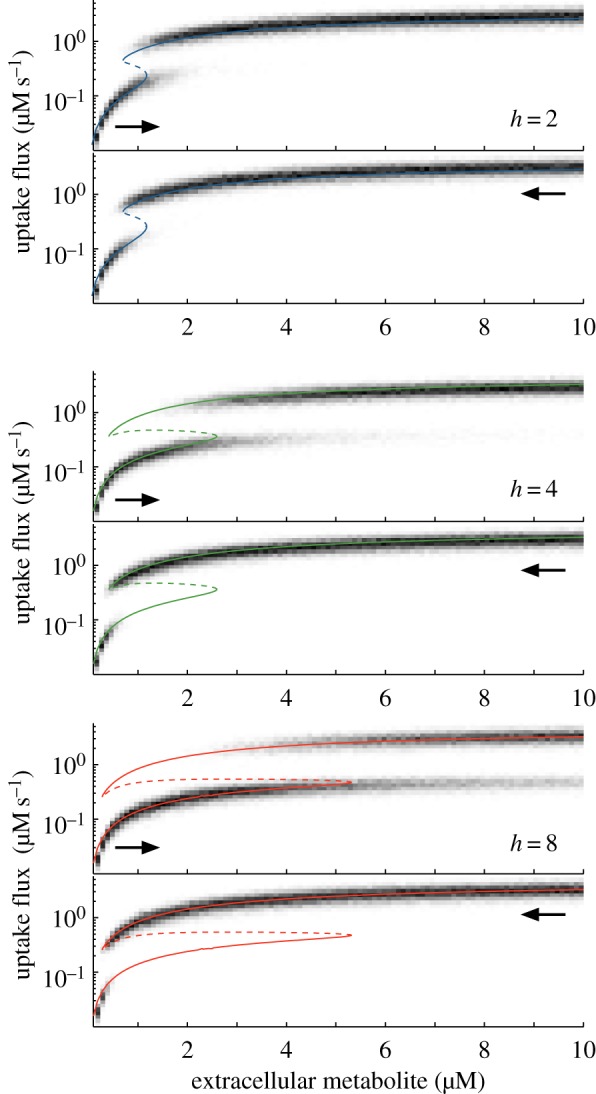
Hysteresis and bimodal phenotypes in the activation-repression circuit. Response of a cell population with variability in the enzyme expression levels. The heat maps are histograms of the population-wide distributions of the uptake flux for increasing or decreasing levels of extracellular metabolite. Cell populations were initialized at low (top panels) or high (bottom panels) uptake fluxes. The greyscale represents the number of cells with a given uptake flux. The histograms were obtained from a population with 500 cells with enzyme expression levels ( and
and  ) sampled from Gamma distributions [39] with means corresponding to the designs in figure 6c and a coefficient of variation of 20%, representative of measured genome-wide fluctuations in protein abundance [40]. The circuit is optimized for a nominal metabolite concentration s0 = 1 µM according to the criterion in (4.5) taken as equality. The histograms are overlaid with the flux bifurcation diagrams computed from figure 6c. Details of the simulations and parameter values can be found in appendix A.2. (Online version in colour.)