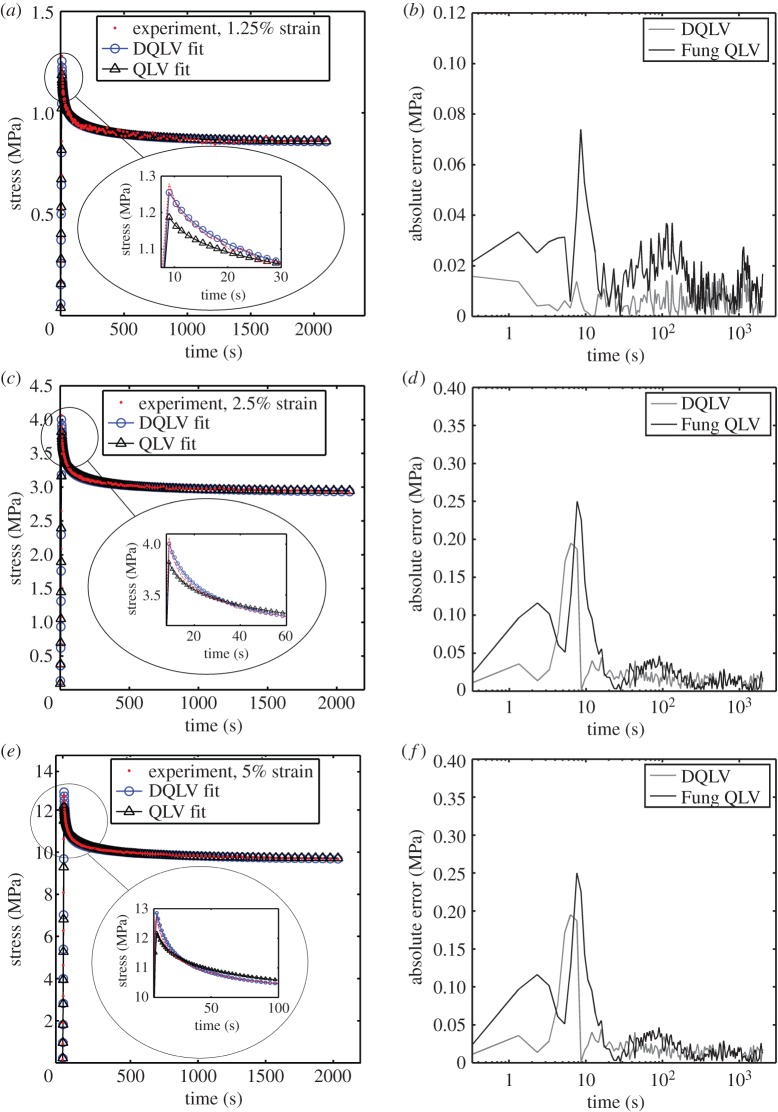
Figure 8.
Demonstration of the fitting methods on experimental stress–relaxation data from a ligament. DQLV and Fung QLV fittings of stress–relaxation data acquired from a rabbit MCL stretched to (a) 1.25, (c) 2.5 and (e) 5% strain. The residuals were substantially lower for the DQLV fittings at all three strain levels: (b) 1.25, (d) 2.5 and (f) 5% strain. (Online version in colour.)

