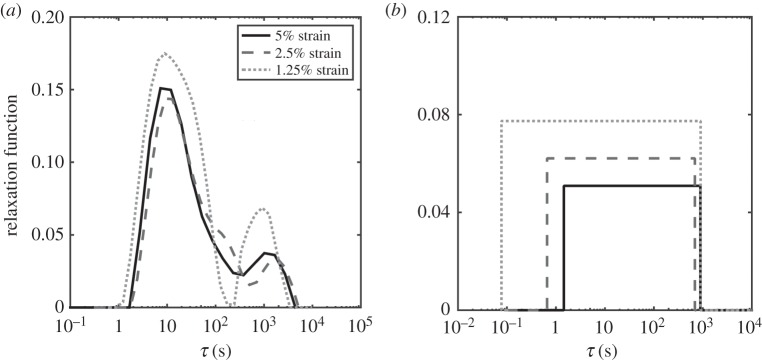
Figure 9.
DQLV and Fung QLV spectra of the rabbit MCL. (a) The DQLV spectra were very similar at all three strain levels, which is a fundamental requirement for using the Fung QLV model. However, the spectra showed two dominant peaks (around 10 s and around 1000 s) rather than a box spectrum, which precludes use of the Fung QLV model. (b) The Fung QLV model produced a poor fit to this spectrum, with the lower range of τ mispredicted and the minor variations of the spectrum with respect to strain exaggerated.

