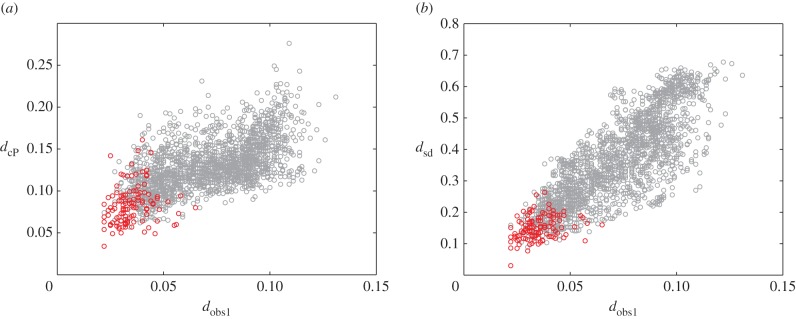
Figure 3.
Comparison of the observer distance with the cP distance (a), and the sd distance (b). Results are shown for the metatarsal database. Red circles correspond to pairs of surfaces from specimens that belong to the same species. The distances between same species pairs are expected to be small for any of the three distance measures. This is indeed the case, as the corresponding points are found to cluster in the lower left corner of the plots. The correlation coefficients between dcP and  and between dsd and
  over all pairs of surfaces are 0.62 and 0.82, indicating that dsd matches better with the observer1 distance, over a broader range or values. We also compute the ratio of the range of distance values for the pairs corresponding to specimens from the same species over the range of values for all pairs of surfaces in the dataset. A lower ratio indicates better performance, as a large ratio would indicate lower discrimination of the significant pairs. We find ratios of 50%, 39% and 36% for the cP distance, the observer1 distance, and the sd distance, respectively.

