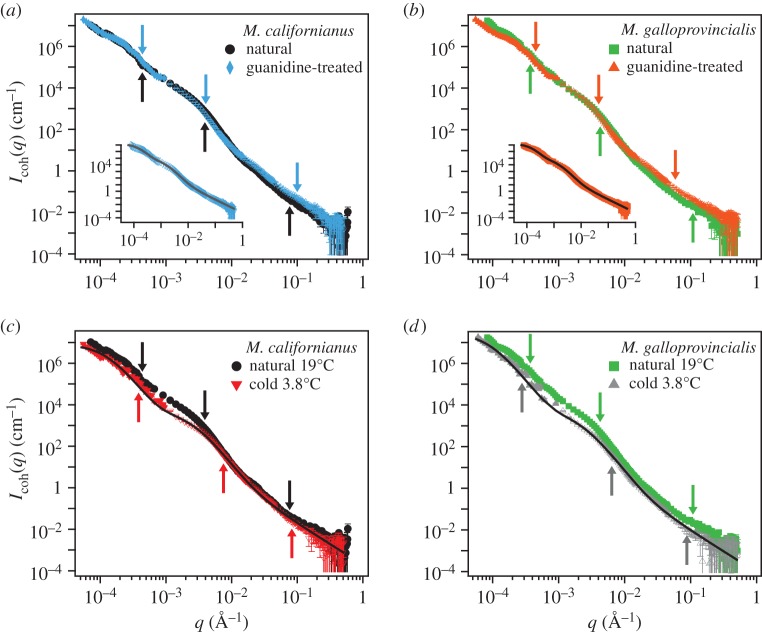
Figure 6.
SANS ( Å−1) and USANS (
 Å−1) scattering intensity and model fit (solid lines) for the (a,c) M. californianus and (b,d) M. galloprovincialis plaques. Arrows (from left to right) indicate
 and
and  (a,b) Plaques made at 19°C, treated with guanidine hydrochloride in D2O which was replaced with D2O prior to measurement. The value of
  does not vary significantly. (c,d) Comparison of natural plaques made at 19°C with those made at 3.8°C. The value of
  is shifted to lower values. (Online version in colour.)

