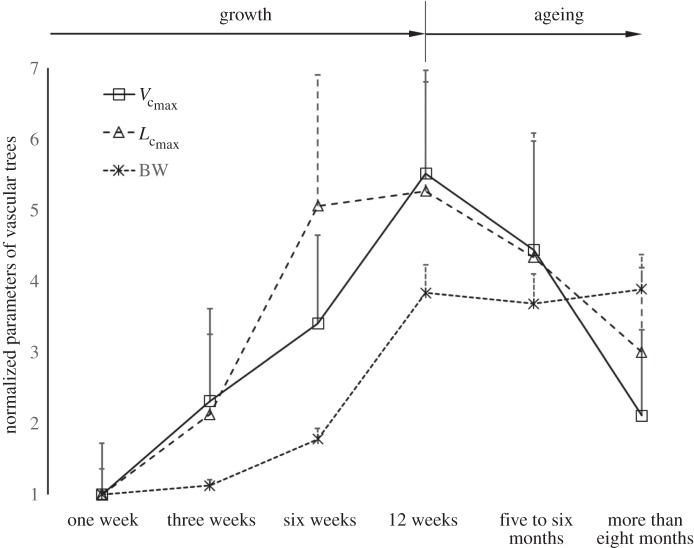
Figure 3.
The mean ± s.d. of  and BW of vascular trees of mice at ages of one week, three weeks, six weeks, 12 weeks, five to six months and more than eight months, where the error bar refers to the s.d. in each age group. The mean ± s.d. values were normalized by the mean values at the age of one week.

