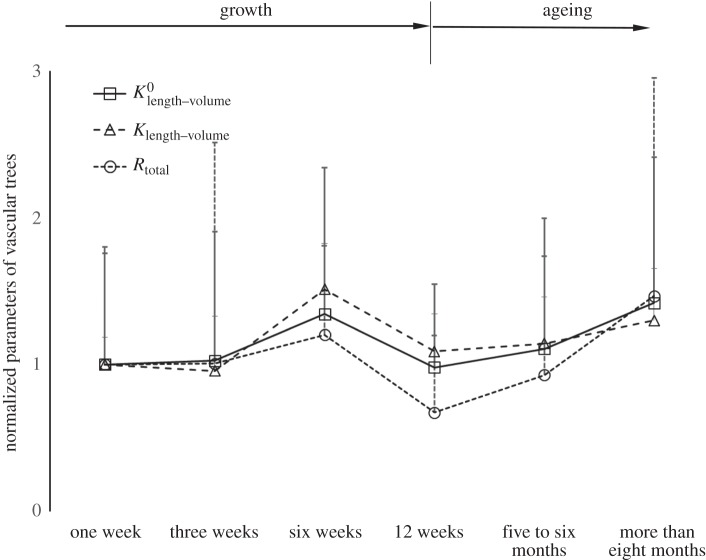
Figure 5.
The mean ± s.d. of  (scaling coefficients determined by the two-parameter model), Klength–volume (scaling coefficients determined by the one-parameter model) and Rtotal of vascular trees of mice at ages of one week, three weeks, six weeks, 12 weeks, five to six months and more than 8 months, where the error bar refers to the s.d. in each age group. The mean ± s.d. values were normalized by the mean values at the age of one week.

