
Table 3.
Scaling coefficients and exponents (mean ± s.d.) of the length–volume scaling law in coronary arterial trees of mice at different ages. mean ± s.d.,  a and Klength–volume were averaged over all coronary arterial trees in each age group.
least-squares fit of both  and a (two-parameter model) and a (two-parameter model) | |||
|---|---|---|---|
length–volume scaling law 
|
 |
a | R2 |
| one week | 797 ± 603 | 0.73 ± 0.09 | 0.96 ± 0.04 |
| three weeks | 818 ± 701 | 0.75 ± 0.08 | 0.93 ± 0.04 |
| six weeks | 1071 ± 795 | 0.73 ± 0.06 | 0.94 ± 0.03 |
| 12 weeks | 782 ± 451 | 0.74 ± 0.05 | 0.94 ± 0.02 |
| five to six months | 883 ± 708 | 0.74 ± 0.06 | 0.96 ± 0.02 |
| more than eight months | 1131 ± 792 | 0.76 ± 0.08 | 0.94 ± 0.03 |
least-squares fit of  with a = 3/4 (one-parameter model) with a = 3/4 (one-parameter model) | |||
|---|---|---|---|
length–volume scaling law 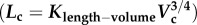
|
 |
R2 | statistical difference (p < 0.05) |
| one week | 712 ± 133 | 0.96 ± 0.04 | 1 w versus 6 w 1 w versus >8 m 3 w versus 6 w 3 w versus >8 m 6 w versus 12 w 6 w versus 5–6 m 12 w versus >8 m |
| three weeks | 681 ± 265 | 0.93 ± 0.04 | |
| six weeks | 1070 ± 215 | 0.94 ± 0.03 | |
| 12 weeks | 776 ± 180 | 0.94 ± 0.02 | |
| five to six months | 814 ± 224 | 0.96 ± 0.02 | |
| more than eight months | 925 ± 256 | 0.94 ± 0.03 | |