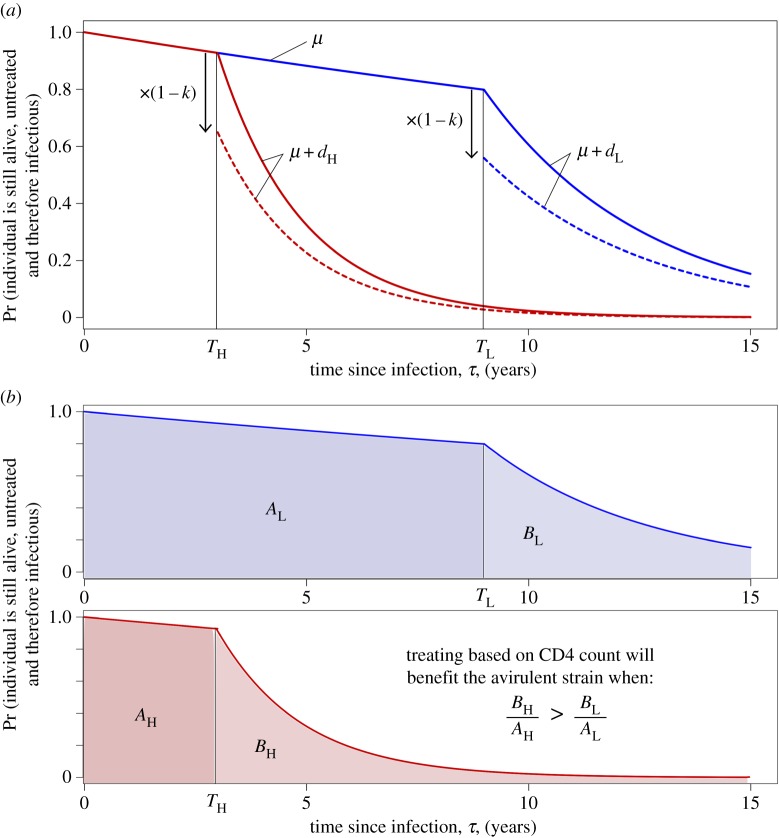
Figure 4.
Diagrams representing the PDE version of the model and the relative importance of low CD4 transmissions. As in figure 3, the high virulence strain (S1) is shown in red and the low virulence strain (S2) in blue. We here assume S1 infections always have high SPVL and S2 infections always have low SPVL (i.e. m = 0, as in the PDE model calculations in the main text). The graphs show the probability that an individual will still be alive and untreated and hence infectious τ years into their infection, plotted against τ. (a) In the PDE model, AIDS-related death of an individual is dependent on time since infection and only occurs after the low CD4 threshold has been crossed. A proportion, k, of treated patients is removed from the infectious class as they reach this threshold, giving rise to the discontinuity. Solid line, no ART; dotted line, ART at 30% coverage. (b) Similar to (a) but split by strain. Shaded areas are proportional to the contribution of that period of the infection to onward transmissions of that strain in a model without treatment. When patients are treated they are no longer infectious (after Tj) and the same proportion are treated for each strain, therefore the effect of ART on the strain balance at equilibrium is determined by the relative importance of low CD4 transmissions, BH/AH compared with BL/AL.

