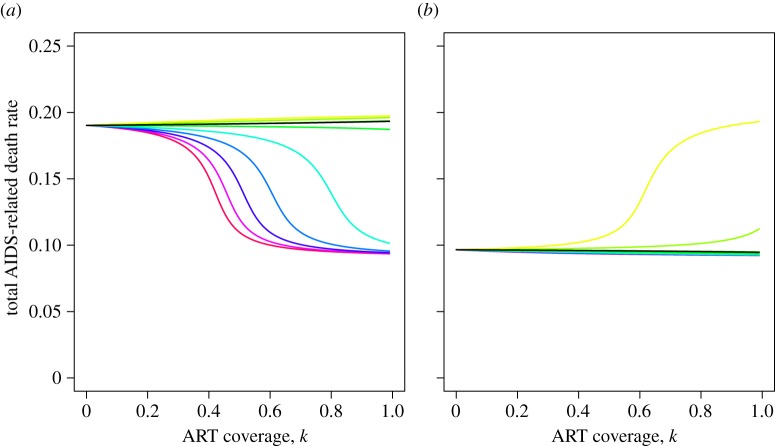
Figure 5.
The relationship between ART coverage and virulence at equilibrium, for different parameter sets. (a)  (b)
(b)  (R0s calculated in the absence of ART). Different coloured lines represent different proportions of S2 transmissions removed as a result of ART. So, with reference to figure 4c, BH/AH is kept constant (parameters TH = 3, dH = 0.57) while BL/AL is varied from low (red line; parameters TL = 8, dL = 0.57) to high (yellow line; parameters TL = 5, dL = 0.2). The ODE model parameters corresponding to these PDE model parameters were calculated as set out in the main text and then the equilibrium position of the ODE model was computed (electronic supplementary material, §1.4) to produce these plots. The black line corresponds to the parameter set in which ART has no effect at equilibrium (equality in (2.8)). Inequality (2.8) was obtained under the assumption that the switching rate, m, is negligible whereas these calculations of the equilibrium behaviour use m = 0.001, hence this black line deviates marginally from the horizontal. Total number of AIDS-related deaths per untreated infected person per year is calculated as in figure 3. The extreme values of this are aH = 1/5 and aL = 1/11 and these are approached when S1 and S2 (respectively) completely dominate at equilibrium. (a) In the absence of ART, S1 dominates at equilibrium. Hence, when BL/AL < BH/AH then ART is able to switch the ordering of the R0s so that S2 dominates at equilibrium. The more severe the inequality between BL/AL and BH/AH, the lower the ART coverage needed to cause this switch. (b) In the absence of ART, S2 dominates at equilibrium, and so this situation is the reverse of (a).

