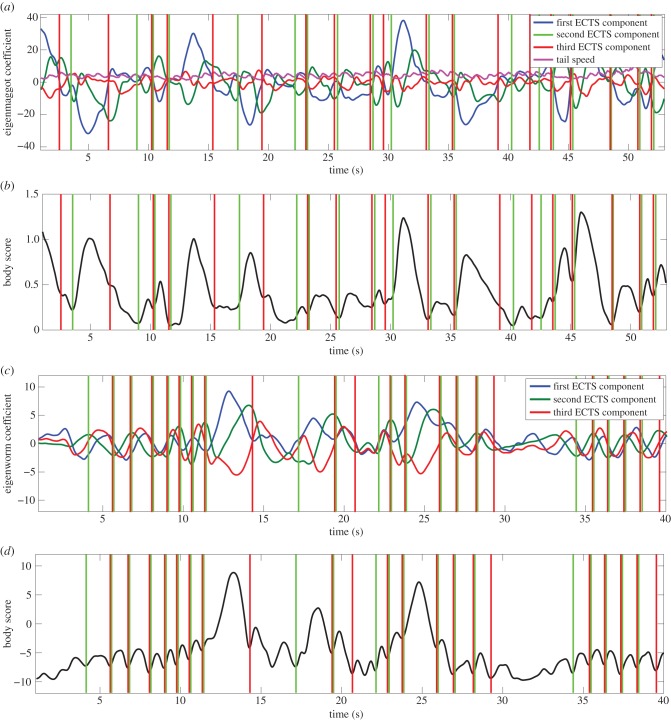
Figure 3.
The segmentation algorithm. Panel (a) shows a screenshot of the larval ECTS and the tail speed time series. Panel (b) shows the corresponding body score, calculated as a weighted average of the ECTS dimensions, where the weights are set by the eigenvalue associated with each eigenshape. Local maximas and minimas in body score determine boundaries between actions, marked as green and red vertical lines for the beginning and end of actions respectively, in both panels (a) and (b). Panels (c,d) show the same information as (a,b) for C. elegans. The sinusoidal segments correspond to locomotion, note that segmentation resolves these into ‘steps'.

