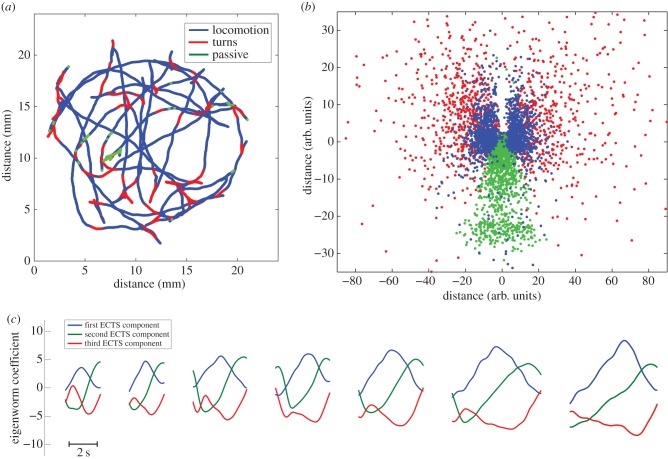
Figure 5.
The structure of behavioural motifs for C. elegans. Panel (a) shows a trajectory colour coded for behaviour. Panel (b) shows a two-dimensional map of the distance among actions as measured by dynamic time warping (R2 = 0.78), see §2.9 for details. The symmetry in the figure corresponds to the dorsal/ventral symmetry in the animal's behaviour. Note that turn events are denser on the negative side of the x-axis. This effect is due to the ventral bias of Ω-turns [23]. Panel (c) illustrates that the ECTS subsequence corresponding to turns can be found at various scales, indicating that Ω-turns are not distinct behaviour, but a part of the continuum of turning behaviours.

