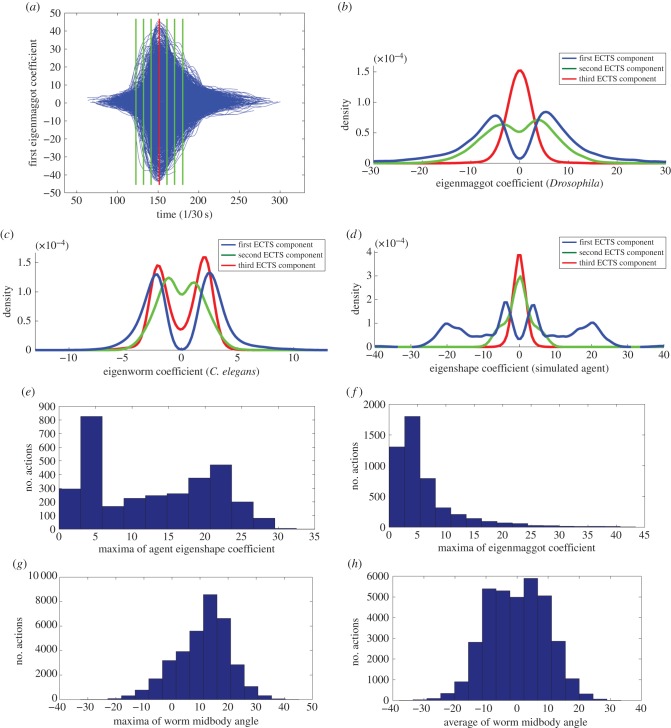
Figure 6.
Continuity among behavioural states. Panel (a) shows the cross section taken across the aggregated ECTS curves. The cross section across the time of peak curvature (red line on a) is shown for Drosophila larva, C. elegans and the simulated agent on panel (b–d), respectively. For clarity, straight runs were removed from the agent's cross section. Panels (e,f) show the histogram of the maxima of first ECTS component during actions for the agent and Drosophila respectively. For the agent, the bimodal distribution indicates two distinct behaviours, but there is no clear cut-off amplitude for the real organism. Panel (g,h) shows the histogram of the maxima and the average of midbody bend for C. elegans actions. Again, we do not find a multimodal distributions, indicating that there is no data-defined threshold to distinguish separate behaviours.

