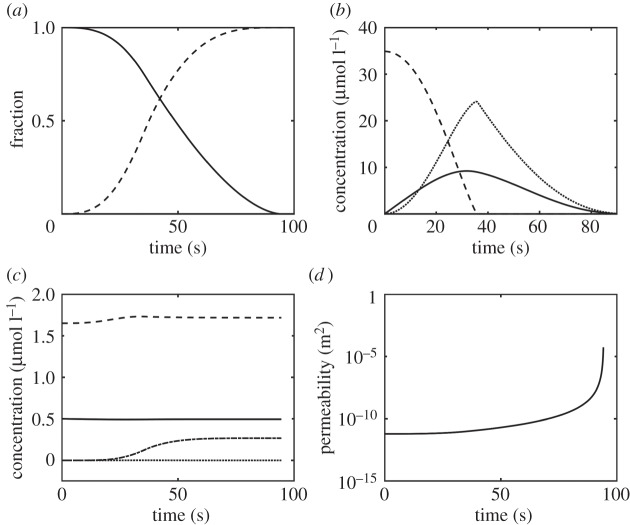
Figure 3.
Temporal variations obtained from the well-mixed kinetics model. (a) Normalized fibre radius and the fraction of clot lysed. Solid line refers to the ratio Rf/Rf0 and the dashed line to the fraction of clot lysed; (b) concentrations of bound tPA ×100 (solid), PLG (dashed) and PLS (dotted); (c) concentrations of free tPA ×10 (solid), free PLG (dashed), free PLS (dotted) and free AP-PLS complex (dotted and dashed) and (d) permeability of the system that tends to infinity as the clot is completely lysed.

