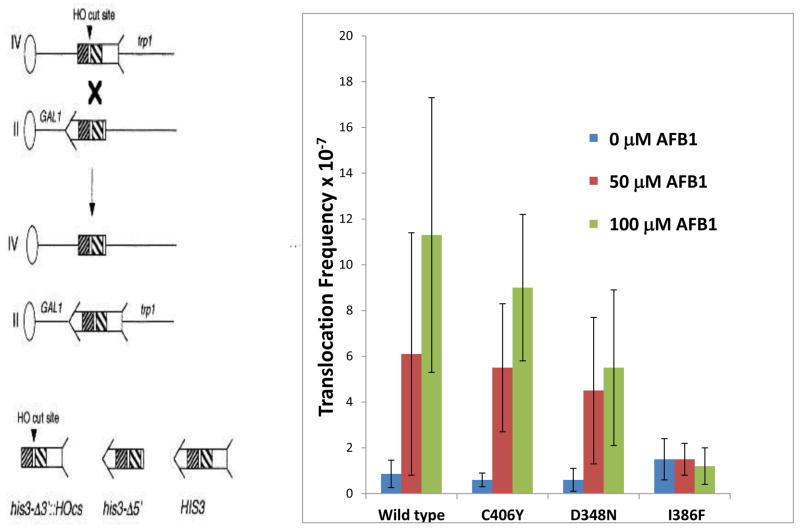
Figure 2.
Frequencies of AFB1-associated recombination in diploid cells expressing CYP1A2 (YB410), CYP1A2 I386F (YB413), CYP1A2 C406Y (YB411), and CYP1A2 D348N (YB412). Figure on the left is a model of the recombination assay. The oval represents a centromere and the line represents the chromosome; the left arm of the chromosome is not shown for simplicity. The his3 fragment is shown with arrow and feathers. The shaded areas represent shared homology. An “X” denotes where a cross-over event would occur. The product of the recombination event is shown below where CEN2 is linked to the long arm of chromosome IV and CEN4 is linked to the long arm of chromosome II. Figure on the right shows the recombination frequencies after cells were exposed to 0, 50 μM, and 100 μM AFB1. The CYP1A2 allele is indicated on the x axis.

