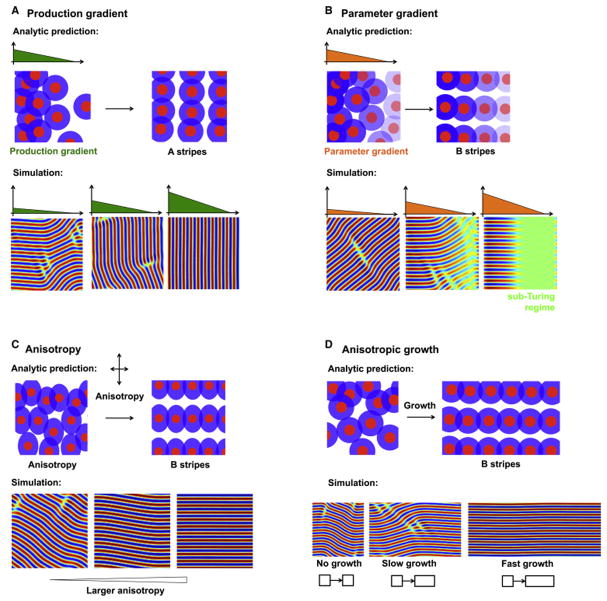
Figure 2. Stripe orientation in the Swift-Hohenberg model.
A: Stripes are oriented perpendicular to a production gradient. Upper: Pattern production varies along the x axis, as schematized by the early spatial bias in pattern density. As the pattern evolves over time, we predict that this will generate stripes parallel to the y axis. Lower: Simulation of Equation 8 shows that stripes are oriented perpendicular to the production gradient.
B: Stripes are oriented parallel to a parameter gradient. A: Interaction strength varies along the x axis, schematized by the graded transparency of the colored sections. We predict that this will generate stripes parallel to the x axis. B: Simulation of Equation 11 confirms that stripes are oriented parallel to the parameter gradient.
C: Stripes are oriented by anisotropies. Upper: A schematic of local activation, long range inhibition with anisotropic interactions. Lower: Simulation of Equation 14 confirms the ability of anisotropies to orient stripes.
D: Stripes are oriented by directional growth. Upper: A schematic of periodic patterning in the presence of uniform growth along the x axis. Lower: Simulation of Equation 1 in the presence of anisotropic growth shows stripe alignment along the direction of growth.

