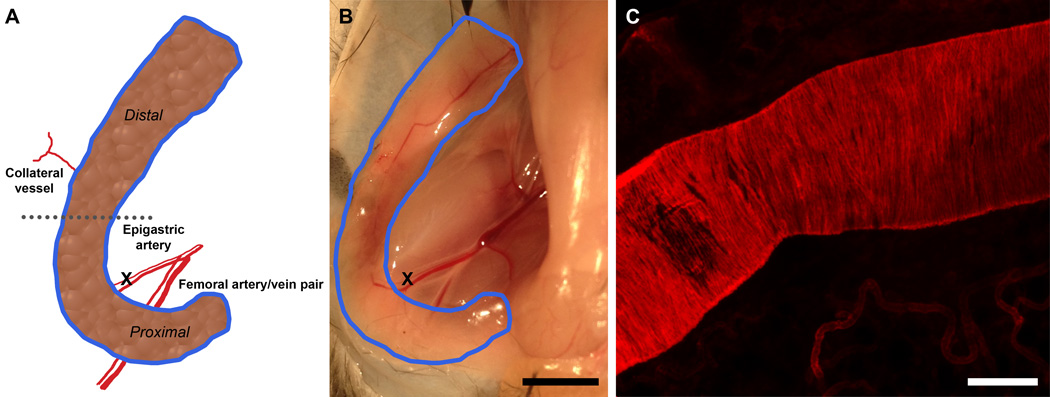
Figure 1.
In vivo murine model of flap delay. A.) Schematic of inguinal fat pad including epigastric artery (ligation site), femoral artery, collateral vessel, and areas of interest. B.) Macroscopic view of inguinal fat pad (outlined in blue) and ligation site. Scale bar = 5 mm. C.) Confocal micrograph of epigastric artery stained with α-smooth muscle actin. Scale bar = 100 µm.

