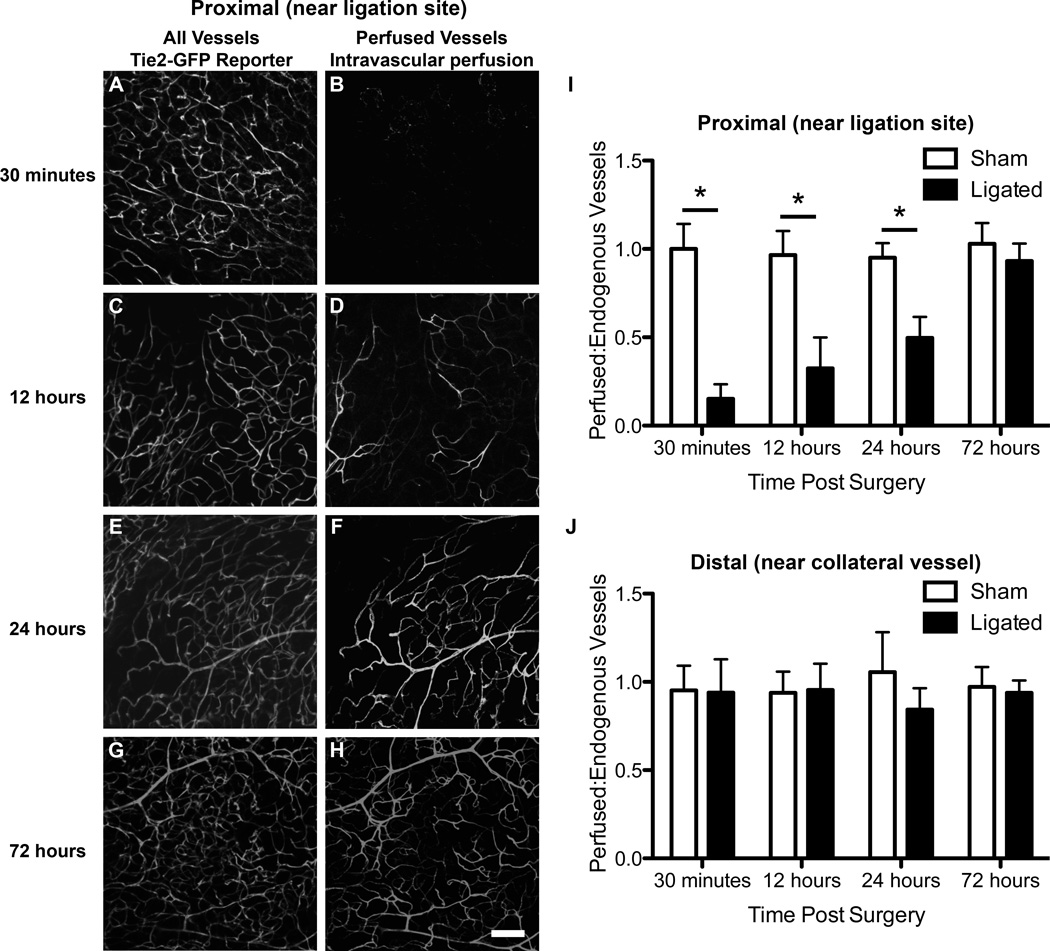
Figure 2.
Confocal micrographs reveal nearly complete flow recovery 72 hours post-ligation in the distal area. All vessels (A,C,E,G) are visualized using the Tie2-GFP mouse, while perfused vessels are visualized using isolectin intravascularly perfused (B,D,F,H). A,B.) All vessels and perfused vessels 30 minutes post-ligation. C,D.) Endogenous and perfused vessels 12 hours post-ligation. E,F.) Endogenous vessels and perfused vessels 24 hours post-ligation. G,H.) Endogenous and perfused vessels 72 hours post-ligation. I.) Quantification of perfusion to all vessels in the proximal region reveals a significant decrease in perfusion in ligated tissue 30 minutes, 12 hours, and 24 hours post-surgery (p-value < 0.05, Two-way ANOVA. J.) Quantification of perfusion to all vessels in the distal region reveals no significant decrease in perfusion in ligated tissue 30 minutes, 12 hours, and 24 hours post-surgery (p-value < 0.05, Two-way ANOVA. Three mice were used for each time point and four FOVs were quantified. Scale bar = 100 µm. Data presented are mean + standard deviation for graphs.

