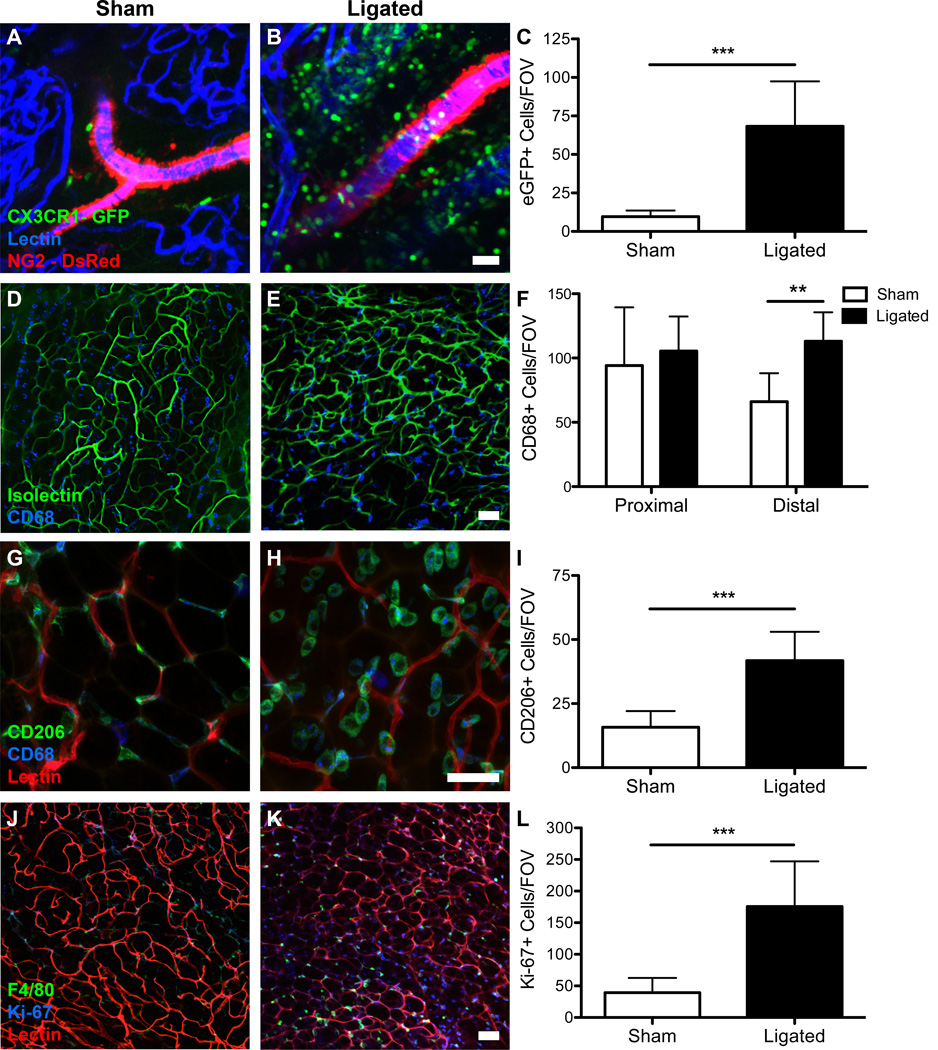
Figure 5.
Immunofluorescence staining reveals an increase in monocyte and macrophage recruitment to ligated tissue and an increase in proliferating cells in ligated tissue. A,B.) Confocal micrographs show an increase in CX3CR1-eGFP+ cells (green) in ligated tissue when compared to sham tissue. C.) Quantification of eGFP+ cells per FOV reveals an increase in eGFP+ cells in ligated tissue (p-value < 0.001, Student’s t-test). Three mice were used and four FOVs were quantified. D,E.) Confocal micrographs show an increase in CD68+ cells (blue) in ligated tissue when compared to sham tissue. F.) Quantification of CD68+ cells per FOV reveals an increase in CD68+ cells in ligated tissue in the distal region (p-value<0.01, Two-way ANOVA). Three mice were used and four FOVs were quantified. G,H.) Confocal micrographs show an increase in CD206+ cells (green) in ligated tissue when compared to sham tissue. I.) Quantification of CD206+ cells per FOV reveals an increase in CD206+ cells in ligated tissue in the distal region (p-value<0.001, Student’s t-test). Three mice were used and four FOVs were quantified. J,K.) Confocal micrographs show an increase in Ki-67+ cells (blue) in ligated tissue when compared to sham tissue. L.) Quantification of Ki-67+ cells per FOV reveals an increase in Ki-67+ cells in ligated tissue in the distal region (p-value<0.001, Student’s t-test). Three mice were used and four FOVs were quantified. Scale bars = 50 µm. Data presented are mean + standard deviation for all graphs.

