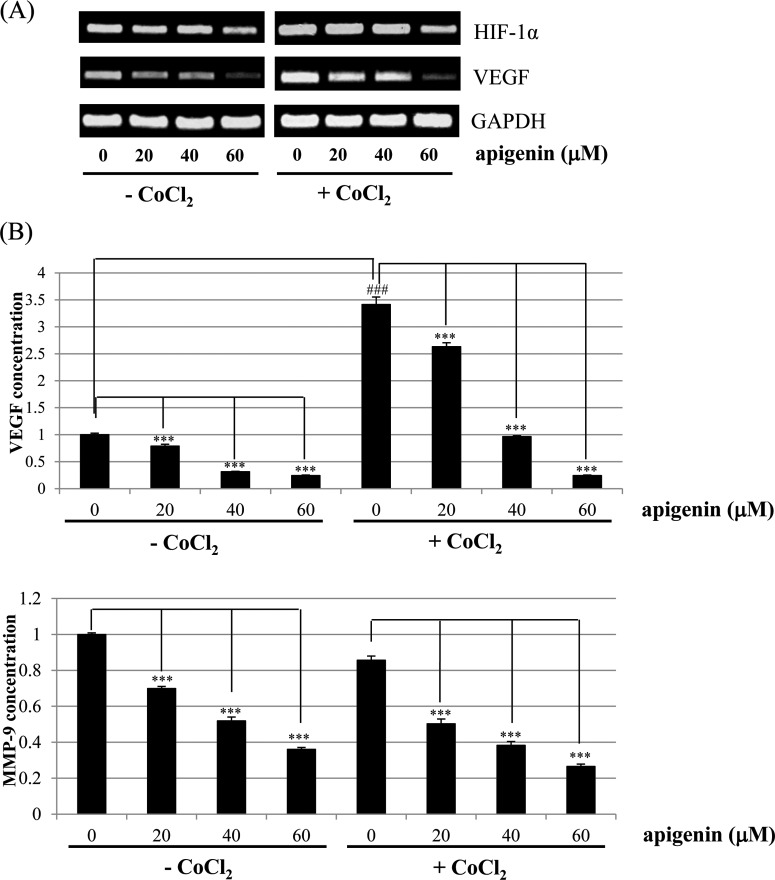
Figure 7. Effect of apigenin on the levels of HIF-1α and VEGF in BT-474 cells.
(A) BT-474 cells were treated with apigenin (0–60 μM) for 24 h in the presence or absence of CoCl2, and the mRNA levels of HIF-1α and VEGF were measured by RT-PCR. The data shown are representative of three independent experiments that gave similar results. (B) BT-474 cells were treated with apigenin (0–60 μM) for 24 h in the presence or absence of CoCl2, and the intracellular VEGF and MMP-9 concentration was measured by ELISA. Data are shown as the means of three independent experiments (error bars denote S.D.). *P<0.05, **P<0.01, ***P<0.001.

