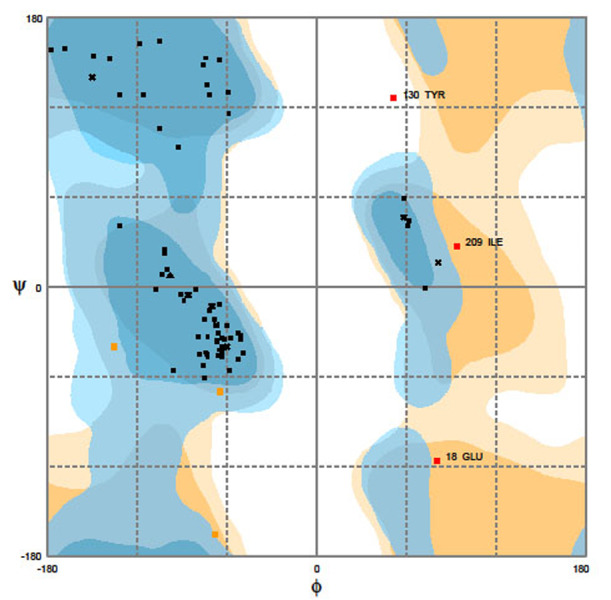
Figure 3.

Evaluation of HA2/Mx1 quality by Ramachandran plot. Percentage of the residue was 97.2% in the favored region, 1.4% in allowed region, and 1.4% in outlier region. The φ and ψ torsion angles of amino acid residues in the proteins were reasonably accurate.
