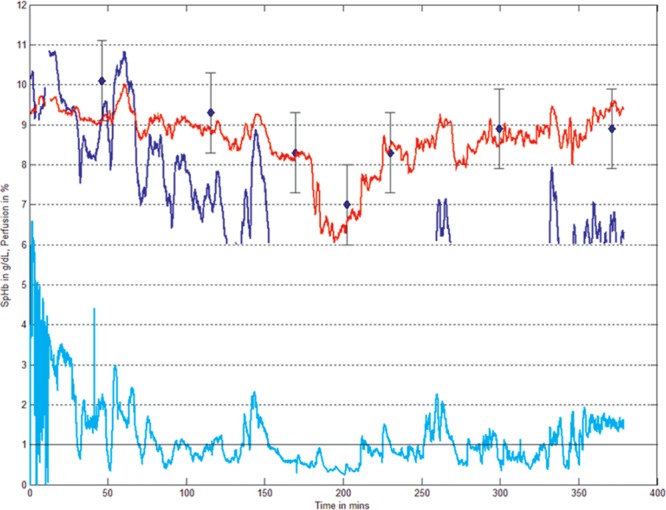
Figure 3.

Revision “K” SpHb sensors (shown in red) have less variability than earlier revision SpHb sensors (shown in dark blue) during side perfusion variation and fewer dropouts during low perfusion (0.3%–1% Perfusion Index, shown in cyan), demonstrating improved trending accuracy compared with lab-Hb (shown in blue diamonds). Actual patient trend plot courtesy of Masimo.
