Fig. 1.
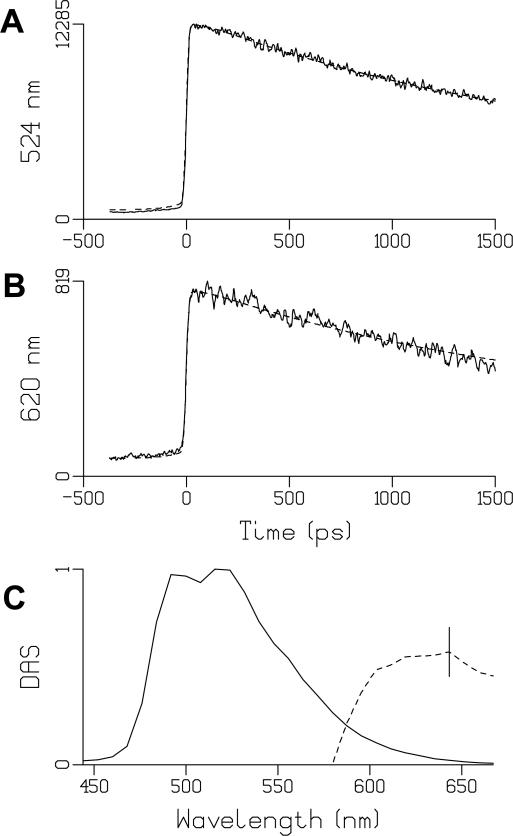
(A, B): Representative traces of LOV2 emission (solid) and their fits (dashed), at 524 nm (A) and 620 nm (B). Estimated lifetime was 2.2 ns. At 524 nm, the signal before time zero can be entirely attributed to the 2.2 ns decay in combination with the backsweep of the synchroscan streak camera system (59). At 620 nm, the relatively higher magnitude of the signal before time zero must be attributed to an additional long lived component. For this we used the 2 μs lifetime of the phosphorescence. During this very long lifetime the signal builds up from about a thousand forward and backward sweeps (the period of the synchroscan is 13 ns). See text for details.
(C) Decay Associated Spectra (DAS) of LOV2. The solid line denotes the 2.2 ns DAS, the dashed line the 2 μs DAS. The dashed phosphorescence DAS has been multiplied by 5 × 10⁴. The vertical bar indicates the estimated standard error, which is negligible for the 2.2 ns DAS.

